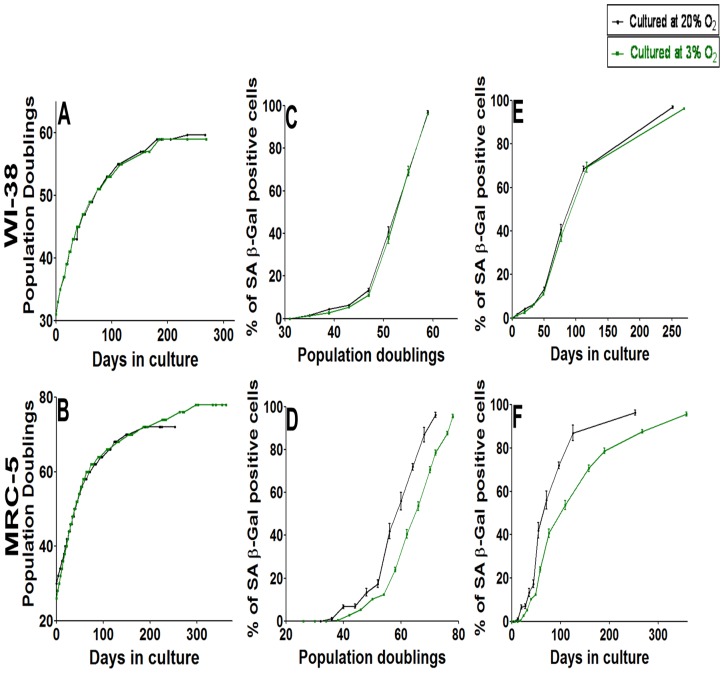
Figure 4. Comparison of the effect of O2 levels (3 or 20%) in culture on the growth curve and induction of senescence revealed by β gal in MRC-5 and WI-38 fibroblasts.
(A & B) Growth curve of 2 independent WI-38 (A) and MRC-5 (B) fibroblast cell lines maintained in culture at 20% or 3% O2 till they achieved senescence at late PD. Data points of all measurements are displayed (not the mean). (C & D) Percentage of SA-β gal positive cells at different time points of their growth in culture in WI-38 (C) and MRC-5 (D) fibroblast cell lines maintained at 20% or 3% O2. The figures were plotted with PDs on the x-axis (E & F) Percentage of SA-β gal positive cells at different time points of their growth in culture in WI-38 (E) and MRC-5 (F) fibroblast cell lines maintained at 20% or 3% O2. The figures were plotted with days in culture on the x-axis. Each curve is measured in triplicate, the mean value is displayed with error bar (± S.E). n = 3.

