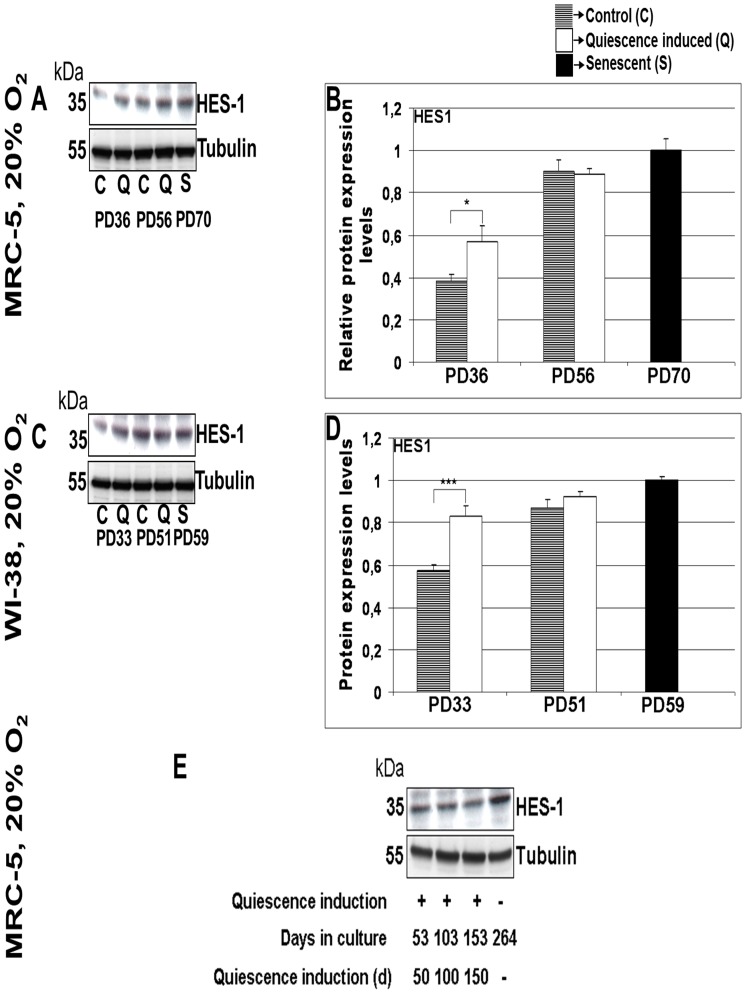
Figure 5. Expression levels of HES1 in MRC-5 and WI-38 fibroblasts subjected to short term or long term quiescence induction.
(A) The blot show the protein expression levels of HES1 in two MRC-5 fibroblast cell lines (control with no quiescence induction and a cell line where quiescence was induced 3 times separately for a span of 9 days) maintained at 20% O2 at different stages of their span in culture. The up or down-regulation was signified by the presence or absence of the bands in Western Blots. (B) Comparison of mean fold change of protein expression levels of HES1 in 3 times quiescence induced MRC-5 cell lines and control MRC-5 cell lines maintained in culture as triplicates. (C) The protein expression levels of HES1 in two WI-38 fibroblast cell lines (control with no quiescence induction and a cell line where quiescence was induced 3 times separately for a span of 9 days) maintained at 20% O2 at different stages of their span in culture. (D) Comparison of mean fold change of protein expression levels of HES1 in 3 times quiescence induced WI-38 cell lines and control WI-38 cell lines maintained in culture as triplicates. The bars indicate the mean ± S.D. * p<0.05, *** p<0.001 - significantly different compared to fibroblasts with PD assigned 1. n = 3 (E) The protein expression levels of HES1 in MRC-5 fibroblast cell lines maintained at 20% subjected to 50, 100 or 150 days of quiescence by contact inhibition and in senescent state. The up or down-regulation was signified by the presence or absence of the bands in Western Blots. n = 2.

