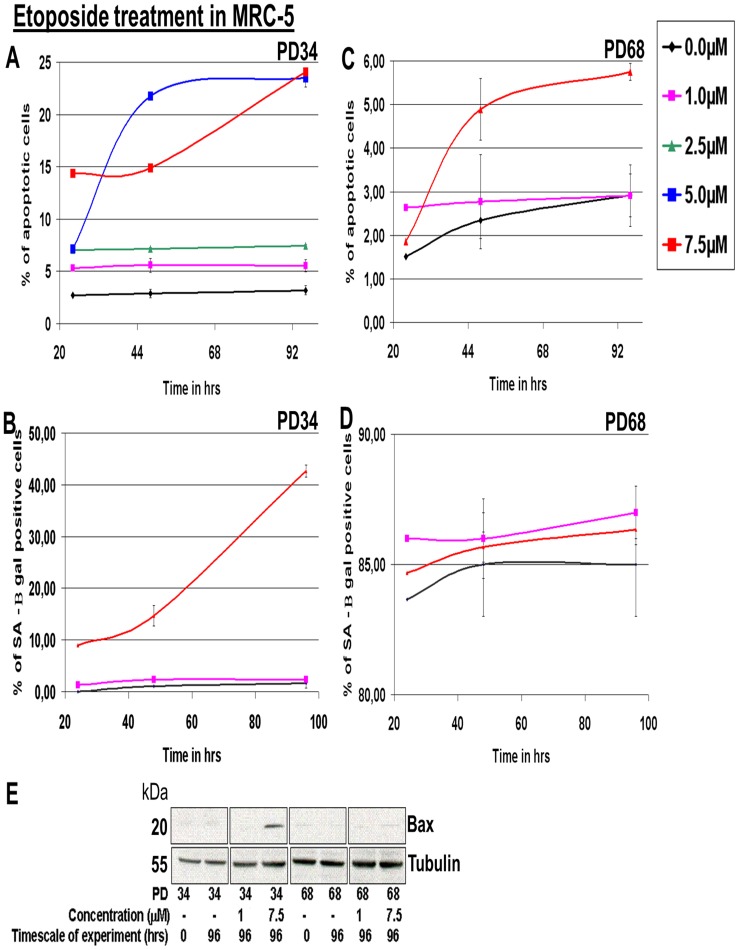
Figure 6. Impact of Etoposide treatment in young and old PD MRC-5 fibroblasts.
(A) Percentage of apoptotic cells in MRC-5 fibroblast cell lines (young PD = 34) treated with different concentrations of Etoposide for different time spans (B) Percentage of SA-β gal positive cells in MRC-5 fibroblast cell lines (young PD = 34) treated with different concentrations of Etoposide for different time spans (C) Percentage of apoptotic cells in MRC-5 fibroblast cell lines (old PD = 68) treated with different concentrations of Etoposide for different time spans (D) Percentage of SA-β gal positive cells in MRC-5 fibroblast cell lines (old PD = 68) treated with different concentrations of Etoposide for different time spans. In each instance, MRC-5 fibroblasts were maintained in culture at 20% O2 as triplicates. In A & C, the bars indicate the mean ± S.D. In B & D error bars indicate ± S.E). (E) The blots show absence or induction of apoptotic protein Bax in MRC-5 fibroblast cell lines (young PD = 34 & old PD = 68) treated with 1.0 or 7.5 µM of Etoposide for 96 hrs compared to controls (0 hrs). The MRC-5 fibroblasts were maintained in culture at 20% O2. The up or down-regulation was signified by the presence or absence of the bands in Western Blots. n = 3.

