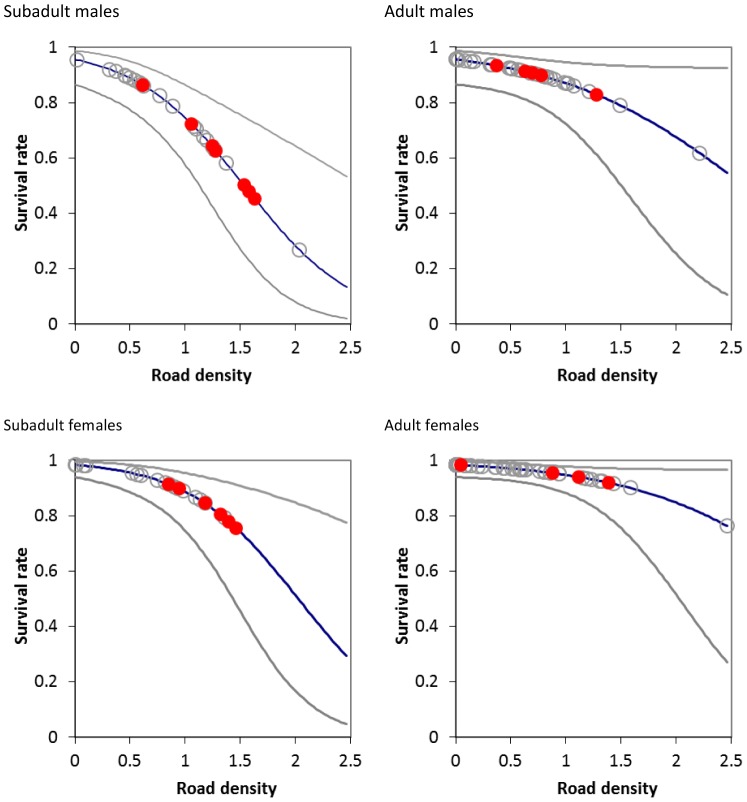
Figure 2. The estimated relationship between road density and age and sex class from known fate model analysis of Alberta grizzly bear data (Model 1, Table 1 ).
Data points for individual bears are shown as circles with mortalities denoted as black dots. Grey lines indicate 95% confidence intervals for predictions.

