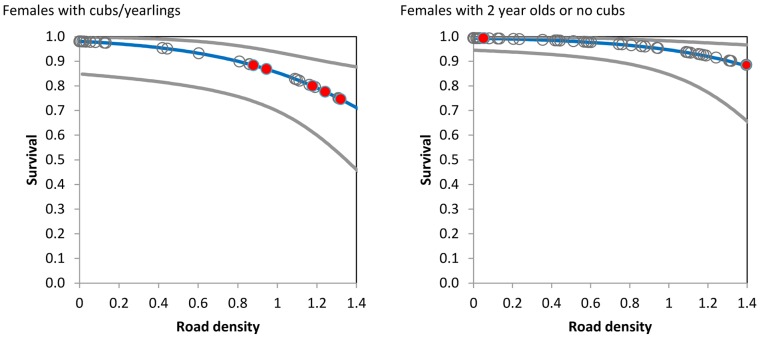
Figure 3. Estimates of survival of females as a function of road density and reproductive status (Model 1, Table 3 ) from the multi-state model analysis of grizzly bears in Alberta, Canada.
Data points are given as grey circles with mortalities filled red. For the Females with 2 year olds or no cubs, there are 2 overlapping mortality points at a road density of 1.4. Grey lines indicate 95% confidence intervals for predictions.

