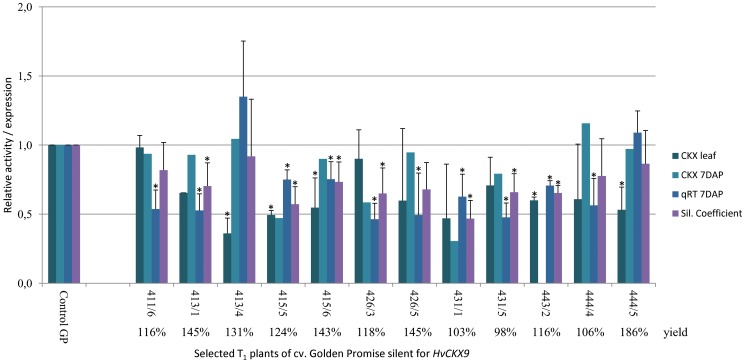
Figure 2. An example of characteristics of segregating T1 plants of cv. Golden Promise silent for HvCKX9.
Bars represent relative levels of CKX activity in leaves and 7 DAP spikes, quantitative transcript level in 7 DAP spikes, and silencing coefficient. Grain yield was estimated as a percentage compared to 100% of control GP. The numbers below the columns are transgenic lines: T0/T1 plant. * - significant differences at P<0.05.

