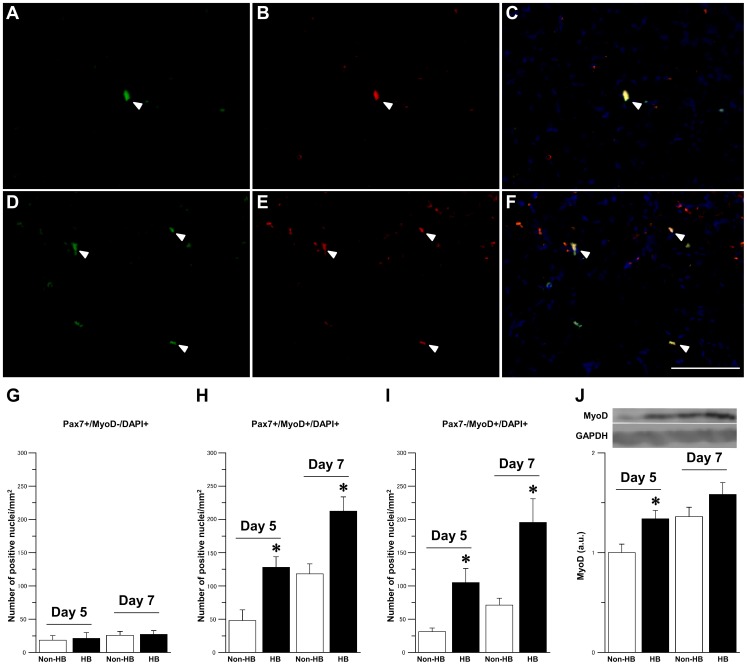
Figure 4. Satellite cells activation. Representative immunofluorescence staining for Pax7 (green; A, D), MyoD (red; B, E), and DAPI (blue), and merged images of signals from both cell markers (C, F) in the Non-HB (A–C) and HB (D–F) groups 7 days after injury.
Arrowheads indicate representative Pax7- and MyoD-positive nuclei. Bar = 100 µm. Number of Pax7+/MyoD-/DAPI+ (G), Pax7+/MyoD+/DAPI+ (H), and Pax7-/MyoD+/DAPI+ (I) nuclei per mm2. Three sections per animal and 5 randomly chosen fields per section were evaluated. The expression level of MyoD protein and representative western blot (J). N = 5 in each group at each time point. Values were calculated as fold changes relative to the Non-HB group at 5 day after injury and represent means ± SE. * is significantly different from the Non-HB group, p<0.05.

