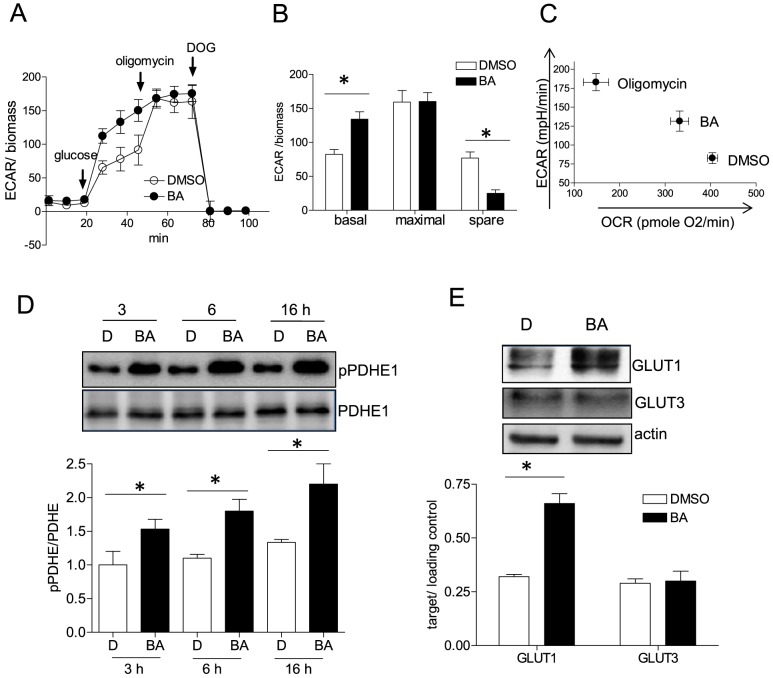
Figure 3. Rate of aerobic glycolysis in the presence of BA.
MEF were treated with 10 µM BA or DMSO (0.1%) for 16 h before they were subjected to a glycolysis stress test as described under “Materials and Methods”. In (A) the extracellular acidification rate (ECAR) is depicted upon exposing cells successively to glucose (10 mM), oligomycin A (2 µM) and deoxyglucose (DOG, 100 mM) (mean + SD; compiled raw data from three independent experiments with four technical replicates each). In (B) those data are analyzed in terms of basal (glycolytic ECAR after glucose addition), maximal (glycolytic ECAR after oligomycin) and spare (maximal minus basal activity) glycolytic activity (mean + SD,* p<0.05, t-test, DMSO vs. BA). Quantitation is based on the value at the final time point of each treatment condition. In (C) values of OCR and ECAR (of DMSO and BA-treated cells (16 h)) after addition of glucose were plotted against each other to visualize the shift from glucose oxidation to glycolysis. The observed shift upon addition of oligomycin A is added to the plot as a reference. (D) MEF were treated with DMSO (0.1%, D) and 10 µM BA for the indicated periods of time before total cell lysates were subjected to immunoblot analyses for pPDHE1 (Ser273) and total PDHE1 (molecular weight 43 kDa). Representative blots out of three experiments are shown. The graph below depicts compiled densitometric values of pPDHE/PDHE (n = 3; mean + SD; *p<0.05; t-test; DMSO vs BA at each time point). (E) MEF were treated with 10 µM BA or DMSO (0.1%) for 16 h before they were subjected to immunoblot analysis for GLUT1 (∼50 kDa), GLUT3 (∼55 kDa) and actin (42 kDa). Representative blots out of three independent experiments are shown. The graph below depicts compiled densitometric values of GLUT1/actin and GLUT3/actin, respectively (n = 3; mean + SD; *p<0.05; t-test; DMSO vs BA at each time point).

