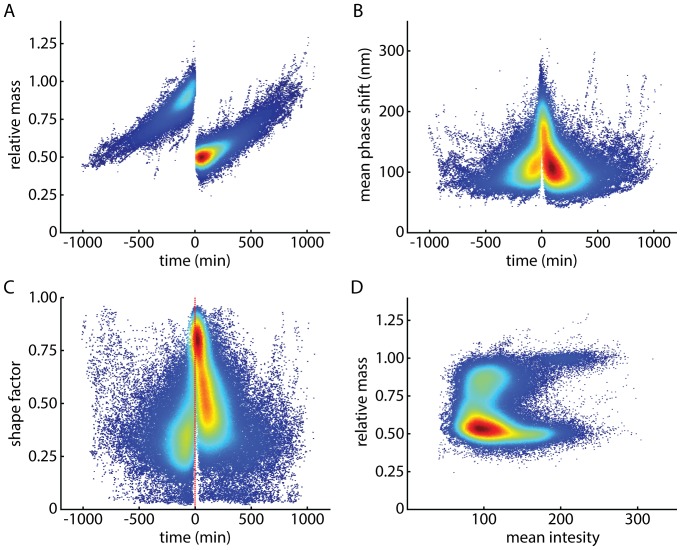
Figure 1. Mass, mean phase shift, and shape factor traces for untreated L-cell divisions.
(A) Mass of dividing L-cells relative to parent cell mass. t = 0 corresponds to the last parent cell mass measurement, just prior to cleavage furrow formation. Color corresponds to the number of observed mass measurements at a given time and mass coordinate, with red being highest number of measurements and blue being lowest. (B) Mean phase shift versus imaging time. (C) Shape factor, defined as 4πA/P 2, versus imaging time. (D) Relative mass versus mean phase shift. Mitotic cells are in the upper right quadrant, recently divided cells in the lower right quadrant.

