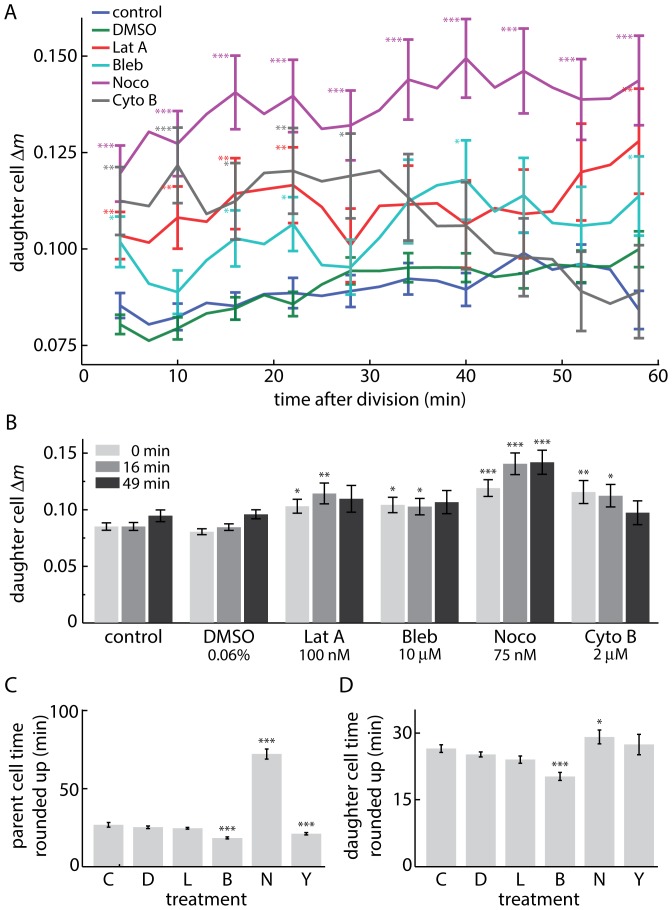
Figure 4. Daughter cell mass partitioning results with cytoskeletal disruption.
(A) Absolute value of daughter cell Δm show an increase in mass partitioning error with cytoskeletal disruption. (B) Daughter cell Δm at select (approximate) time points from A. (C) time parent spent rounded up in mitosis prior to division. (D) time daughters cell spent rounded up before first daughter cell flattened out. C: control (n = 437), D: DMSO 0.06% (n = 587), L: latrunculin A 100 nM (n = 132), B: blebbistatin 10 µM (n = 129), N: nocodazole 75 nM (n = 116), Y: cytochalasin B 2 µM (n = 81). Error bars represent s.e.m of all tracked divisions. * p<0.05, ** p<0.01, *** p<0.001. Statistical significance in A and B was determined relative to control measurements at each corresponding timepoint.

