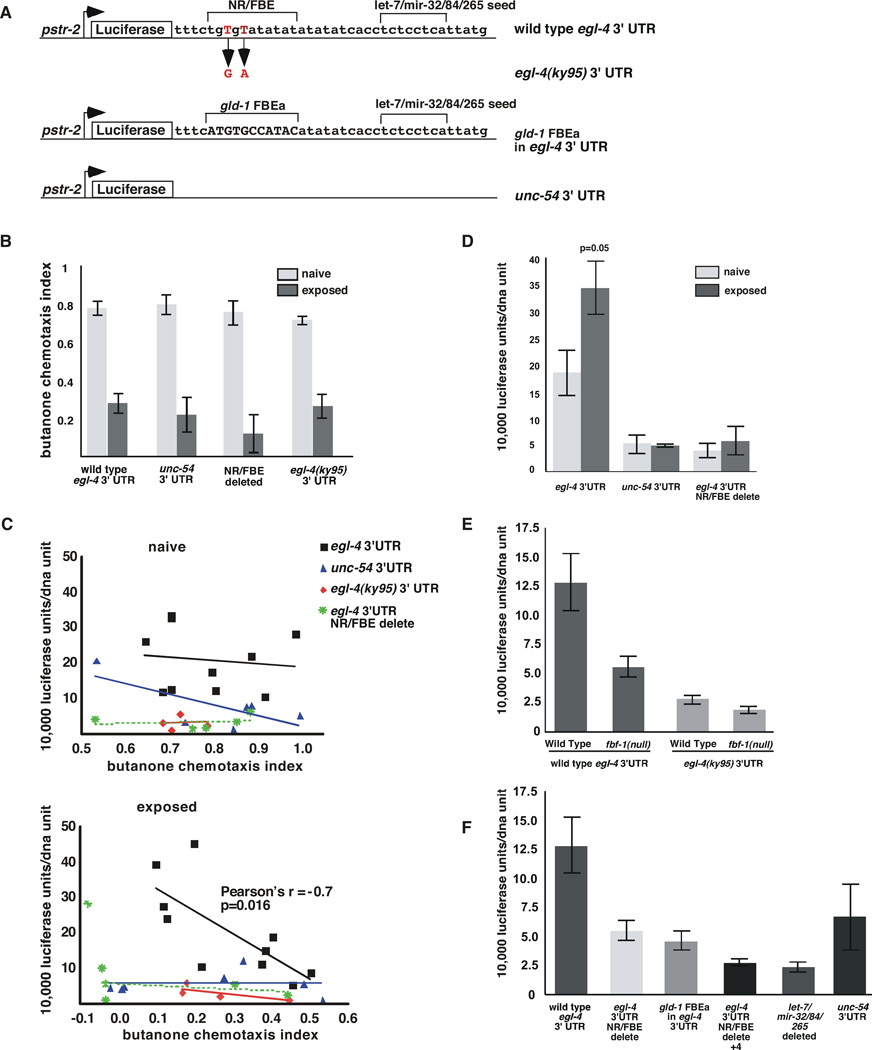
Figure 5. The egl-4 NR/FBE and a predicted let-7/mir-32/84/265 miRNA seed sequence both promote expression of a Luciferase-based reporter in the AWC neuron.
(A) Diagram of Luciferase-based reporters. All were placed under the control of the str-2 promoter and each contains the indicated 3’ UTR. Upper brackets indicate the nucleotides that were deleted. The longer NR/FBE delete in Figure 5F extends 4 n.t. 3’ of the NR/FBE brackets.
(B) Chemotaxis assays were performed on naïve and odor-exposed animals carrying the indicated transgenes.
(C) Top The chemotaxis behavior (CI) of naive animals (X axis) to butanone was not correlated with luciferase expression (Y axis) in any of the reporter strains examined. When the wild type egl-4 3’ UTR flanks this reporter, Pearson’s r is -0.12 p=0.74, for the unc-54 3’ UTR Pearson’s r is −.71 p=0.11, for the ky95 3’ UTR Pearson’s r is 0.04, p=0.96 and for NR/FBE delete Pearson’s r is 0.17, p=0.78.
Bottom The chemotaxis index of odor-exposed animals correlated well with luciferase expression when the wild type egl-4 3’ UTR flanks this reporter (1 independent line) (Pearson correlation r = −0.7324, *p= 0.016 and Spearman’s correlation r= −0.7939 and **p= 0.0088). Expression was uncorrelated with behavior after odor-exposure when the egl-4 3’UTR (1 line) was replaced by the unc-54 3’UTR (Pearson’s r=0.01, p=0.98), the NR/FBE was mutated to mimic the ky95 allele (2 lines) (red diamonds, Pearson’s r=−0.74, p=0.26), or the NR/FBE was deleted (1 line) (Pearson’s r=−0.33, p=0.58). Each point represents a single assay in which a population was divided and a portion was subjected to a chemotaxis assay and the other portion to luminometry followed by qRT-PCR to obtain units of luciferase per unit of transgenic DNA.
(D) Luciferase values in populations of naïve worms that chemotaxed well (CI>0.8, light grey) were compared to those that adapted robustly (CI<0.2, dark grey bars). Luciferase expression was 1.85 fold higher in animals that adapted well than in the naive animals (p=0.05 n=3). Error bars denote the s.e.m.
(E) Luciferase reporter expression in the AWCON neuron in naïve animals was examined as a function of the 3’ UTR. The wild type egl-4 3’UTR (5 independent lines, see Supplemental Materials on details of expression from each line) in wild-type animals conferred 2.4 fold more expression (n=40) than when it was expressed in fbf-1(ok91) mutant animals (3 lines, p=0.0061 n= 15), 4.5 fold higher than the ky95 3’ UTR expressed in wild-type animals (2 lines, p=0.0003 n=15) and 6.4 fold higher than the ky95 3’ UTR expressed in fbf-1(ok91) (2 lines p<0.0001 n=11). fbf-1(ok91) animals expressing the wild-type 3’UTR showed 2.3 fold more luciferase expression than fbf-1(ok91) animals expressing the ky95 3’ UTR (p=0.0025). Expression from the ky95 3’ UTR reporter was not significantly different in wild-type and fbf-1(ok91l) animals (p= 0.1591).
(F) The NR/FBE and flanking sequence elements promote basal levels of expression from the egl-4 3’UTR. In wild-type worms, the egl-4 3’UTR (5 lines) was expressed 2.3 fold more than the NR/FBE deleted 3’ UTR (1 line,** p=0.0077, n=9), 2.8 fold more the gld-1 FBEa substitution (3 lines, **p=0.0028, n=25), 4.8 fold more than the NR/FBE+4 b.p. delete (3 lines, ** p=0.0002 n=9) and 5.2 fold more than the let-7/mir-32/84/265 deletion (2 lines ***p=0.0002, n=8). The unc-54 3’UTR drove 2.4 fold less expression than the wt egl-4 3’UTR 1 line, p=0.0449 n=8). Luciferase/unit DNA values for wild type egl-4 3’ UTR, gld-1-subsitiuted FBE 3’ UTR and unc-54 3’ UTR lines did not follow a normal distribution thus P values were obtained using a Welch-corrected two-tailed T-test using Prism software. Error bars denote s.e.m.

