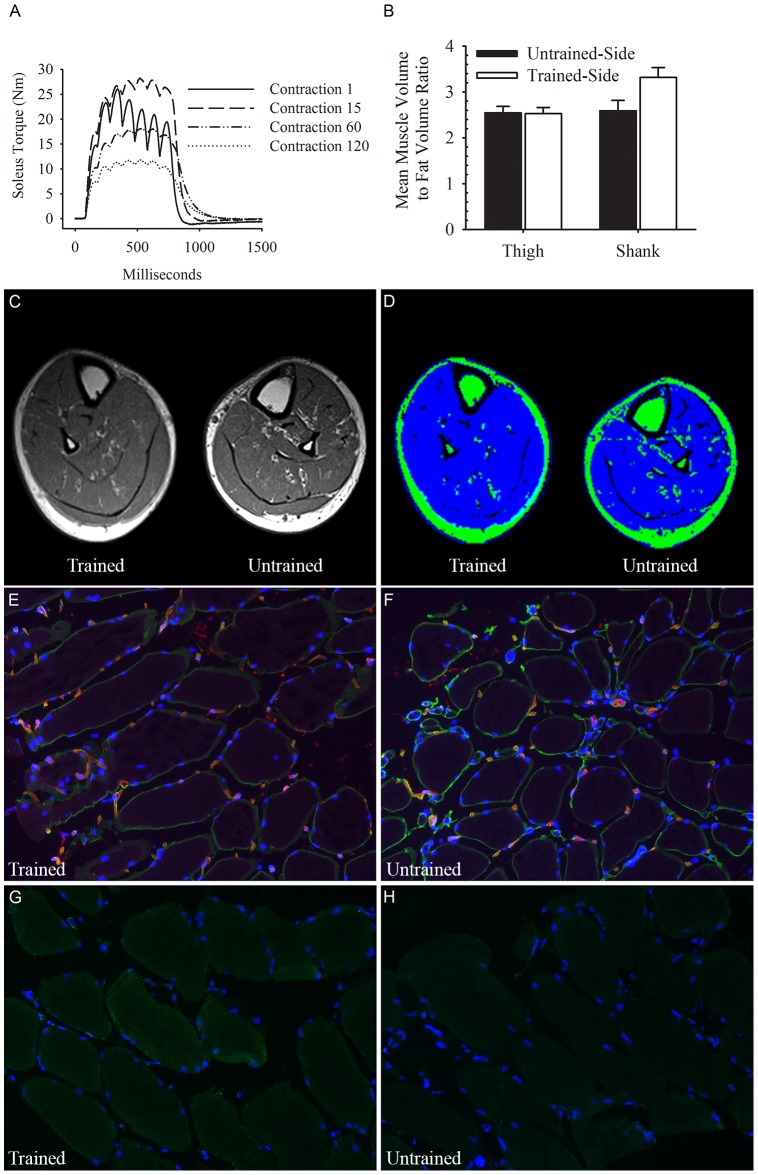
Figure 1. A representative example of the phenotype for a trained and untrained human paralyzed muscle.
(A) A representative example of the torque produced during the stimulation of a chronically paralyzed human soleus muscle, contractions 1, 15, 60, and 120 during the first bout of electrical stimulation are illustrated. (B) The ratio of muscle to adipose tissue from several MR images slices of the proximal shank and distal thigh after >7 years of unilateral soleus electrical stimulation training in subject 1. A representative MR Image slice of the trained and untrained lower leg before (C) and after (D) implementing the muscle and fat tissue segmentation algorithm. Immunofluorescence stain for collagen IV (green) in a chronically trained (E) and untrained (F) paralyzed muscle. Note the loss of collagen IV (green) in the chronically trained muscle. Immunofluorescence stain (green) for mitochondrial distribution in a trained (G) and untrained (H) paralyzed muscle.

