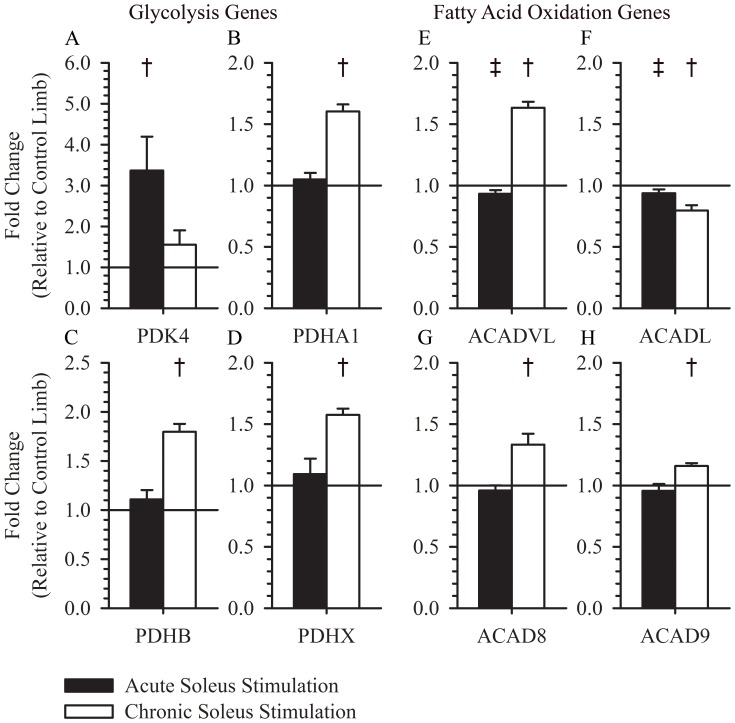
Figure 4. Expression of glycolysis and fatty acid oxidation genes following acute or chronic stimulation.
PDK4 was increased 3 hours after a single session of muscle stimulation (3.37±0.83, p = 0.008), but was unchanged after >1 year of soleus training (1.55±0.35, p = 0.21) (A). PDHA1 (1.60±0.057, p<0.001) PDHB (1.80±0.08, p<0.001), and PDHX (1.57±0.05, p<0.001) were increased after >1 year of muscle training, but were unchanged 3 hours after a single session of muscle stimulation (1.05±0.05, p = 0.46, 1.11±0.09, p = 0.35, 1.09±0.13, p = 0.59; respectively) (B, C, and D). ACADVL (0.93±0.03, p = 0.064) was decreased 3 hours after a single session of muscle stimulation, but was increased after >1 year of muscle training (1.63±0.049, p = 0.049) (E). ACADL (0.94±0.031, p = 0.098) was decreased 3 hours after a single session of muscle stimulation and after >1 year of muscle training (0.80 and ACADL (0.94±0.031, p = 0.098) were decreased 3 hours after a single session of muscle stimulation 0.044, p = 0.025) (F). ACAD8 (1.33±0.089, p = 0.023) and ACAD9 (1.16±0.023, p = 0.006) were increased after >1 year of muscle training, but were unchanged 3 hours after a single dose of muscle stimulation (0.96±0.042, p = 0.33, 0.96±0.06, p = 0.39; respectively) (G and H). † indicates a p-value <0.05 for a within group paired t-test. ‡ indicates a p-value <0.10 for a within group paired t-test.

