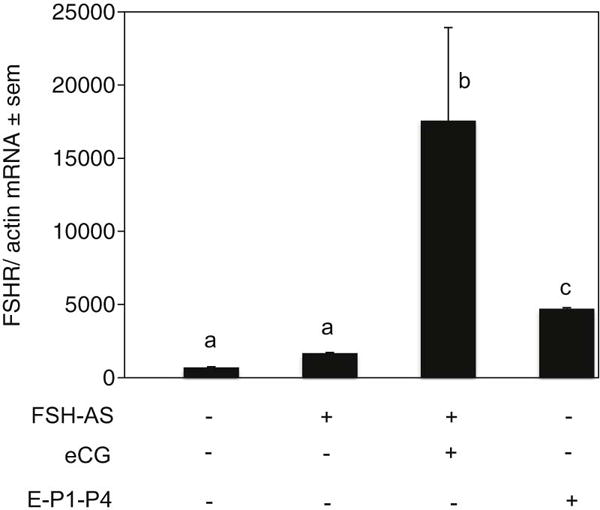
Fig. 6.

Expression of FSHR mRNA in the ovaries of P8 hamsters exposed in utero with an anti-FSH serum on E12 with or without 20 IU eCG treatment on P1, or with 1 μg estradiol-17β treatment on P1 and P4. Each bar represents the ratio of FSHR and β-actin ± standard error of mean (sem). P<0.05, bars with different letter.
