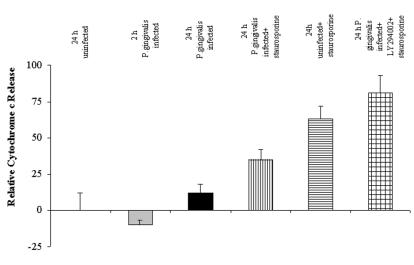
FIG. 7.
Cytochrome c release by infected GECs determined by flow cytometry. The treatment and time course for each condition are the same as for Fig. 6. The number of cells with high fluorescence (intact mitochondria) and the number of cells with low fluorescence (cytochrome c released) were quantified by flow cytometry analysis following staining with FITC-conjugated anti-cytochrome c antibody (details are described in Materials and Methods). Bars represent the percentage of cells in each condition compared to uninfected, untreated controls, which were set at 100%. Twenty-four-hour-infected cells had high fluorescence, as detected by fluorescence microscopy. Significant numbers of LY294002- and staurosporine-treated, infected cells had very low fluorescence, indicating substantial loss of cytochrome c from mitochondria. Data are expressed as means from at least two separate experiments, and the values represent the means and standard deviations of separate measurements.

