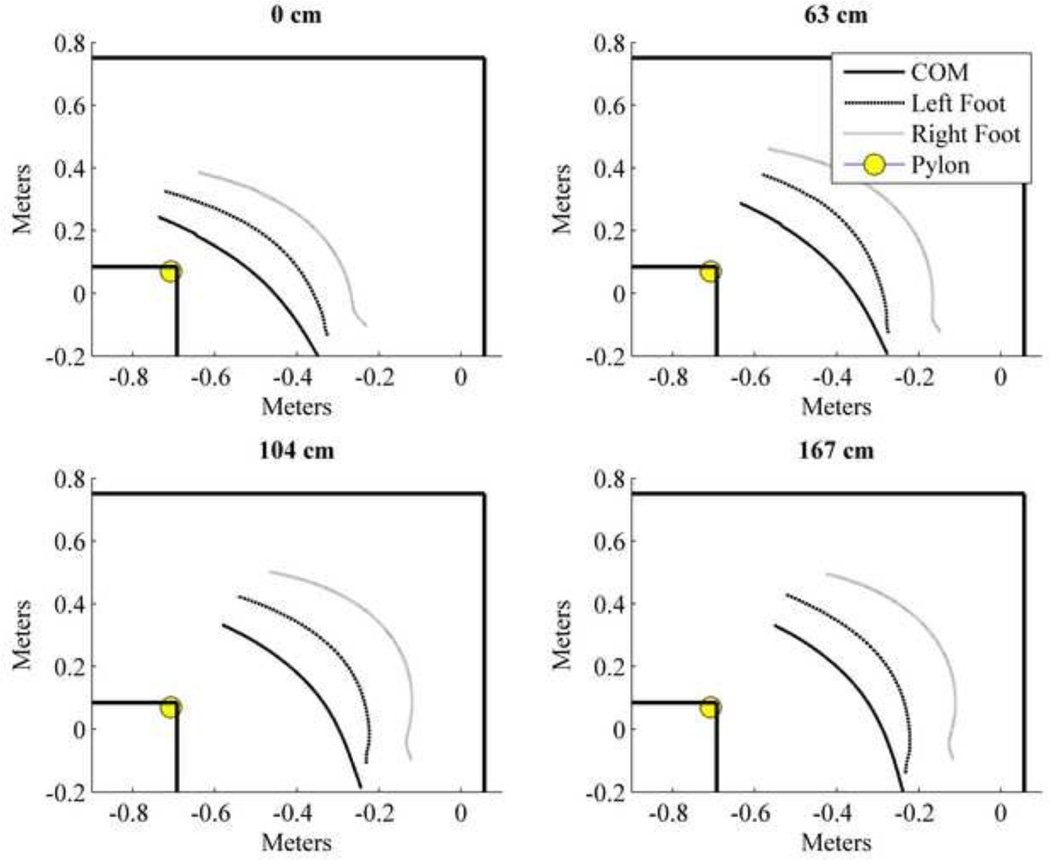
Figure 4.
Population average plots for the whole-body (solid line), left foot (dashed line), and right foot (dotted line) COM trajectories over the first half of stance phase for each obstacle height. For all heights, the COM remains outside of the BOS for the entire first half of stance phase. As obstacle height increased, the curvature of the COM trajectory also increased. Left and right foot trajectories show the overall average trajectories which include both step and spin turns.

