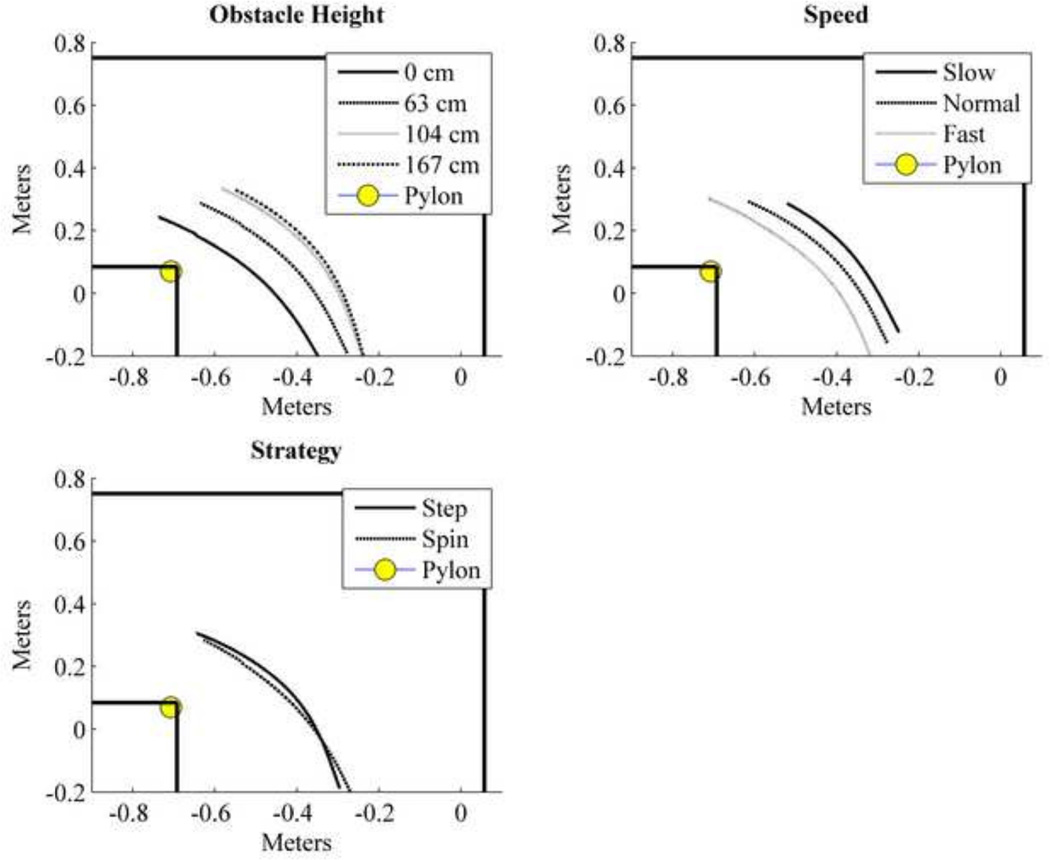
Figure 7.
Population average plots for the COM trajectories separated by variable to show the different trajectories’ average curvatures. Increasing obstacle height resulted in increased curvature. Slower speeds had higher curvature than fast walking speeds. Step turns showed greater curvature than spin turns.

