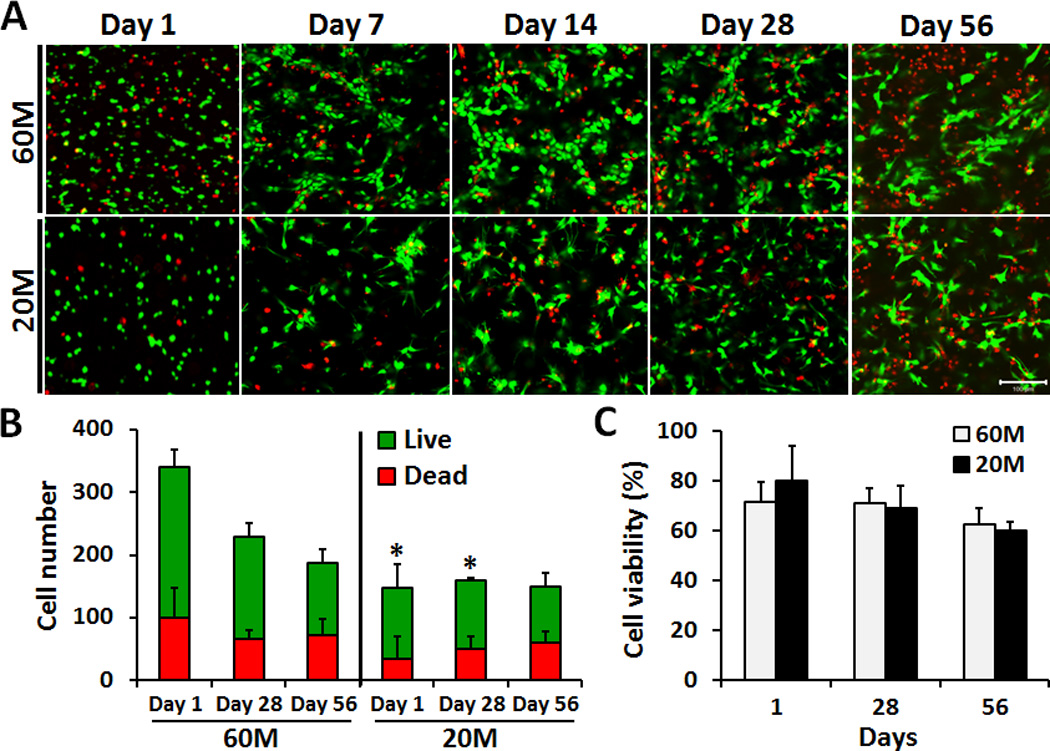
Fig. 1.

A) LIVE/DEAD staining of NPC-seeded HA constructs on days 1, 7, 14, 28 and 56 after encapsulation at either 60M or 20M seeding density (20× magnification, scale bar: 100 µm). B) Quantification of NPC number (live and dead) from images at days 1, 28 and 56. C) Quantification of NPC percent viability in HA constructs on days 1, 28 and 56.
