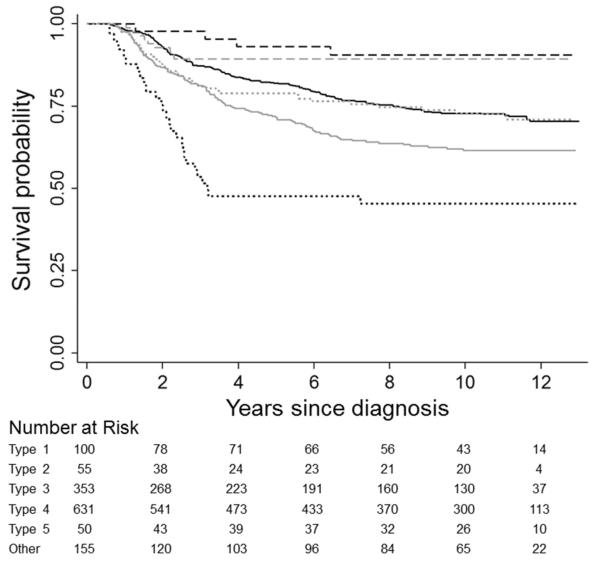
Figure 1.
Kaplan-Meier survival curves comparing disease-specific survival in colorectal cancer patients by tumor subtype: type 1 (dashed black), type 2 (dotted black), type 3 (solid gray), type 4 (solid black), type 5 (dashed gray), some other tumor marker combination (dotted gray). Subtypes are defined as follows: type 1 = MSI-high, BRAF-mutated, KRAS-mutation negative, CIMP+; type 2 = MSS/MSI-low, BRAF-mutated, KRAS-mutation negative, CIMP+; type 3 = MSS/MSI-low, BRAF-mutation negative, KRAS-mutated, non-CIMP; type 4 = MSS/MSI-low, BRAF-mutation negative, KRAS-mutation negative, non-CIMP; type 5 = MSI-high, BRAF-mutation negative, KRAS-mutation negative, non-CIMP

