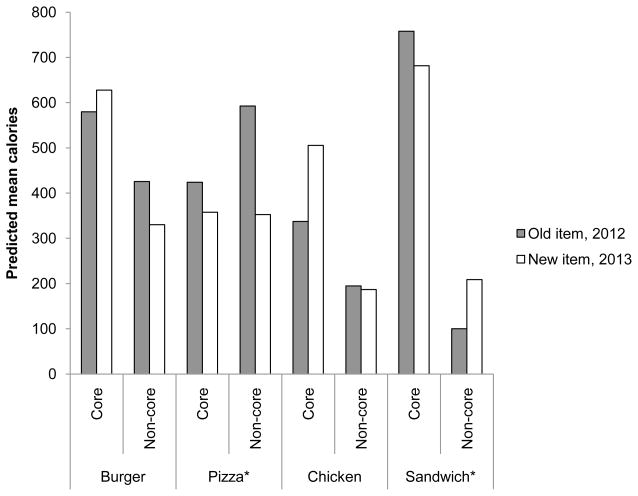
Figure 2.
Predicted mean per-item calories among new menu items in 2013 versus items offered in 2012, comparing core to non-core items in restaurants with a specific menu focus
Notes: Histograms of predicted mean per-item calories among newly introduced menu items in 2013 versus that of menu items offered in 2012, comparing core to non-core items in restaurants with a specific menu focus in the 30 restaurants with a specific focus. Core items in burger restaurants include only burgers (n=77), and non-core items include all else (n=1,381). Core items in pizza restaurants include only pizzas (n=209), and non-core items include all else (n=120). Core items in chicken restaurants include only chicken items (n=27), and non-core items include all else (n=89). Core items in sandwich restaurants include only sandwiches (n=642), and non-core items include all else (n=384). Predicted mean per-item calories are from generalized linear models adjusting for children’s menu item status, whether a restaurant chain is national, and restaurant type (fast food, full service, fast casual).
* Difference in calories between old and new items in core vs. non-core items is significant at p<0.05.

