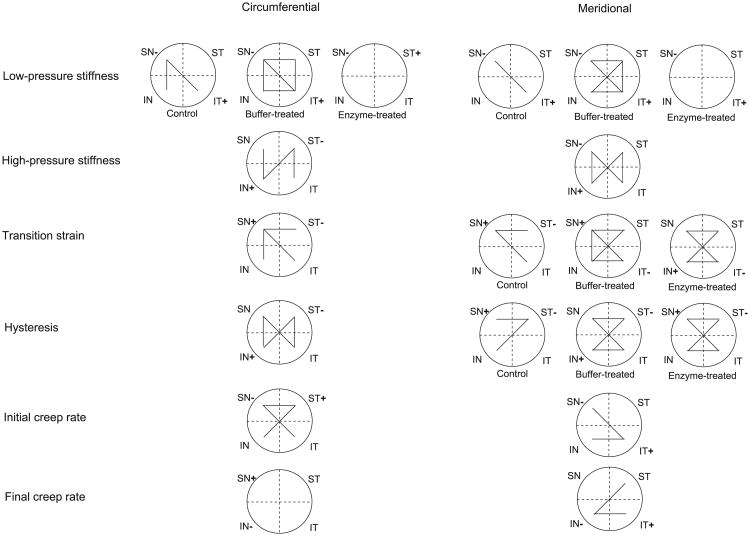
Fig. 5.
Schematic of the spatial variations for all mechanical outcomes, in the circumferential and meridional directions, assessed using linear mixed models. For the mechanical outcomes and directions having a significant interaction between group and quadrant, these variations were presented for each group. Each segment linking 2 quadrants indicates a significant difference between them. The plus and minus signs indicate the quadrants with the highest and lowest parameter value, respectively.

