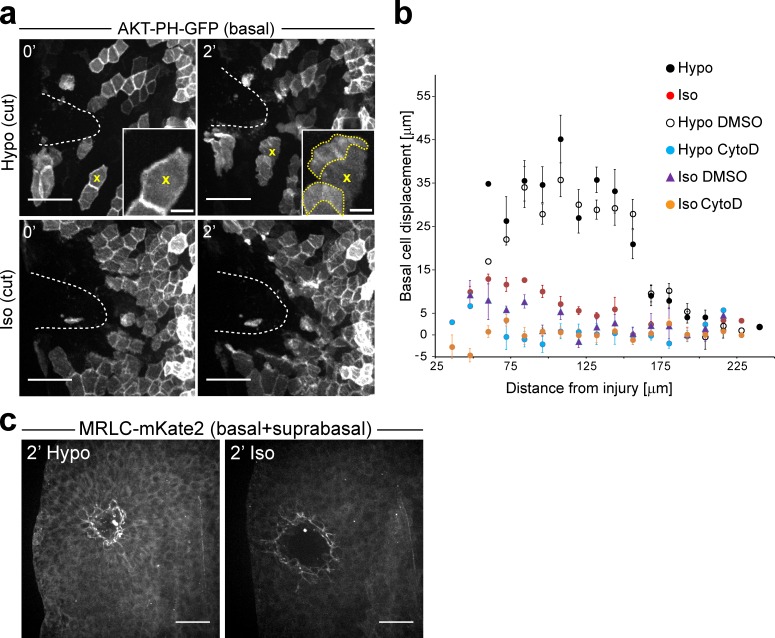
Figure 3.
A drop in interstitial osmotic pressure after injury stimulates basal cell migration. (a) Representative images of 2.5–3-dpf zebrafish larvae mosaically expressing AKT-PH-GFP in basal cells (4–8-cell-stage mRNA injection), immersed in hypotonic or isotonic bathing solutions at the indicated times after UV laser cut injury. Broken white lines, wound margin. Yellow x, representative cell developing a lamellipodium (yellow dotted line) in response to a wound-induced exposure to hypotonicity. (b) Quantification of basal cell migration in zebrafish larvae mosaically labeled by one-cell stage actb2:Akt-PH-GFP DNA injections. Cell migration was tracked for ∼19 min after wounding in hypotonic medium (Hypo), isotonic medium (Iso), and hypotonic medium supplemented with 100 µM cytochalasin D (Hypo CytoD) to probe actin-dependent motility, DMSO control (Hypo DMSO), isotonic medium supplemented with 100 µM cytochalasin D (Iso CytoD), or Iso DMSO control (Iso DMSO). Mean basal cell displacement as a function of initial distance to the wound is shown for n = 123 cells/8 tail fins (Hypo), 114 cells/8 tail fins (Iso), 62 cells/5 tail fins (Hypo DMSO), 86 cells/6 tail fins (Hypo Cyto D), 79 cells/7 tail fins (Iso DMSO), and 122 cells/8 tail fins (Iso CytoD). Error bars indicate SEM. (c) Representative images of myosin II recruitment 2 min after UV-puncture injury in hypotonic (left) or isotonic (right) medium. Myosin recruitment is visualized by mKate2-labeled myosin regulatory light chain (one-cell stage mRNA injection). Bars: (a, main panels) 50 µm; (a, insets) 10 µm; (c) 50 µm.

