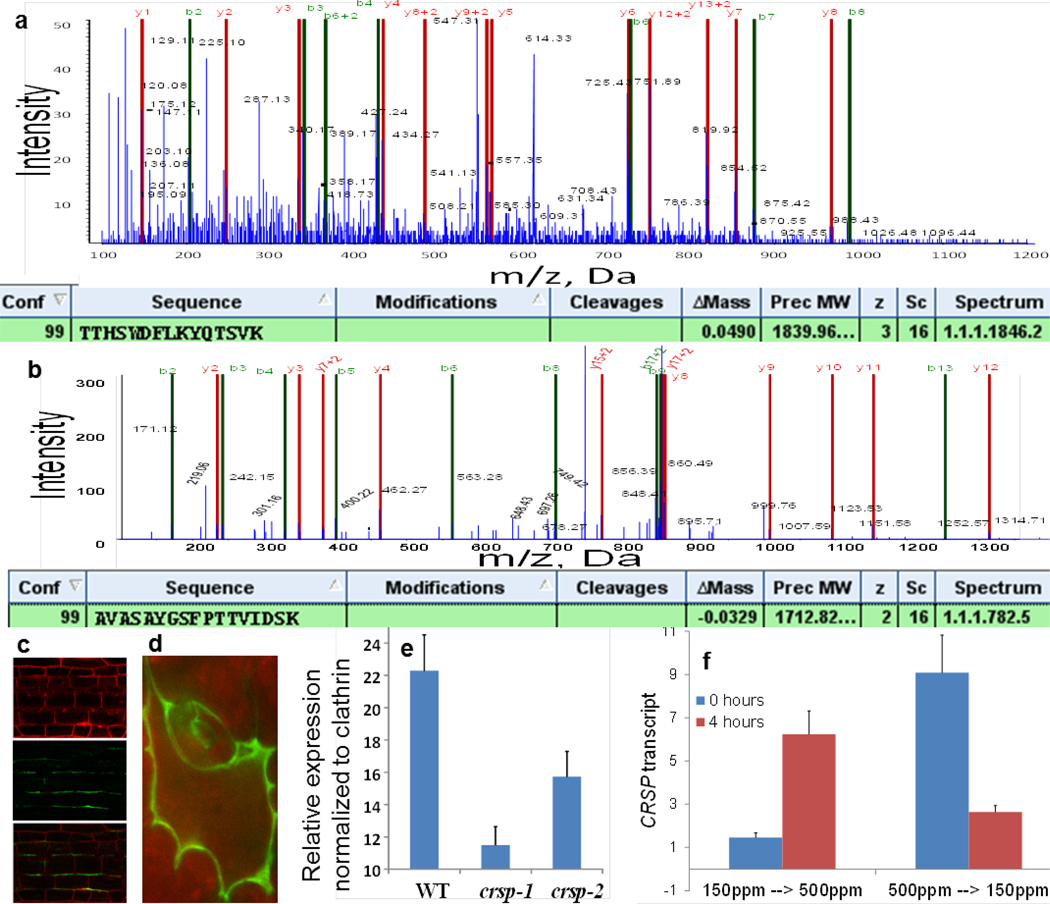
Extended Data Figure 5. Tandem mass spectrometry (MS/MS) spectra identifying the protease CRSP in the apoplast proteome, CRSP localization, qPCR for T-DNA insertion alleles in CRSP and the effects of short term exposure to step changes in the CO2 concentration on CRSP mRNA levels.
Leaf apoplast proteomic experiments identified the following: SBT1.7 (also known as ARA12; identified in four out of five experiments), SBT1.8 (the closest homologue of ARA12; identified in three out of five experiments), SBT5.2 (At1g20160; identified in four out of five independent apoplast proteomic experiments) and SBT3.13 (identified in two out of five independent apoplast proteomic experiments). SDD1 is distantly related to SBT5.2 and has been shown to function independently of EPF1 and EPF2. It belongs to the SBT1 clade of the subtilisin-like serine proteases. a, Example product ion spectrum for the native peptide TTHSWDFLKYQTSVK of CRSP, which was recovered directly from the apoplast extract before trypsin digestion. The product ion spectrum for the parent ion of m/z = 614.33 (+ 3) is shown. Apoplast proteins were isolated, purified and subjected to MS/MS as described in the Methods. b, The product ion spectrum for the peptide AVASAYGSFPTTVIDSK of CRSP, which was identified from trypsin digestion of the apoplast extract. The product ion spectrum for the parent ion of m/z = 857.44 (+ 2) is shown. The product ion spectra are annotated for y, y + 2, b and b + 2, using the Paragon algorithm (ProteinPilot 4.0 AB SCIEX). The tables show the identification results for the peptides using ProteinPilot 4.0. Conf. denotes the percent confidence (99%) score for the identified peptide. Cleavages means any potential mis-cleavage. Delta Mass is the theoretical mass – the measured mass. Z is the charge state. c, d, A translational fusion of the CRSP protease with VENUS (driven by the 5′ promoter fragment comprising the 2,000 basepairs of genomic sequence directly upstream of the first ATG of CRSP) localizes to the cell wall in A. thaliana plants. Hypocotyl (c) and sixth leaf epidermal cells (d) of 10-day-old seedlings are shown. Hypocotyl samples were counter-stained with propidium iodide (top panel) and imaged for VENUS fluorescence (middle panel); the bottom panel shows the merged image. Pending detailed characterization of the sites of CRSP protein expression and localization, it is not known whether the biological activity of CRSP’s modulation of stomatal development in response to an elevated CO2 stimulus originates either from stomatal precursor stem cells or from other cell types such as mature stomata. e, qPCR analyses of 10-day-old seedlings were conducted for WT, crsp-1 (SALK_132812C) and crsp-2 (SALK_099861C) seedlings. Twenty seedlings were pooled, and the RNA was isolated for cDNA synthesis and subsequent qPCR. The expression levels were normalized to those of the CLATHRIN gene. qPCR results suggest approximately 55% reduction in CRSP transcript abundance in seedlings carrying the crsp-1 mutant allele upstream of the T-DNA insertion site. Note that the CRSP-1 translated protein exhibits reduced cleavage of EPF2 (Extended Data Fig. 6a). The crsp-2 mutant has a T-DNA insertion at the 3′ end of the last (ninth) exon and shows partially reduced CRSP transcript levels. Primer sequences 5′ of the T-DNA insertion sites amplified CRSP transcripts (Methods, for primer sequences). f, qPCR analyses of 10-day-old WT seedlings were conducted for plants grown at 150 p.p.m. (left) or 500 p.p.m. (right) CO2. After 10 days of growth at these conditions, the plants were transferred to the opposite CO2 growth conditions for 4 h. CRSP transcripts were quantified via qPCR in cotyledons (ACTIN 2 was used as the housekeeping gene with which to normalize cDNA levels) before (0 h; blue bars) and after (4 h; red bars) the step change in CO2 concentration. n = 10 in e and n = 20 in f. Error bars, mean ± s.e.m. in e and f.

