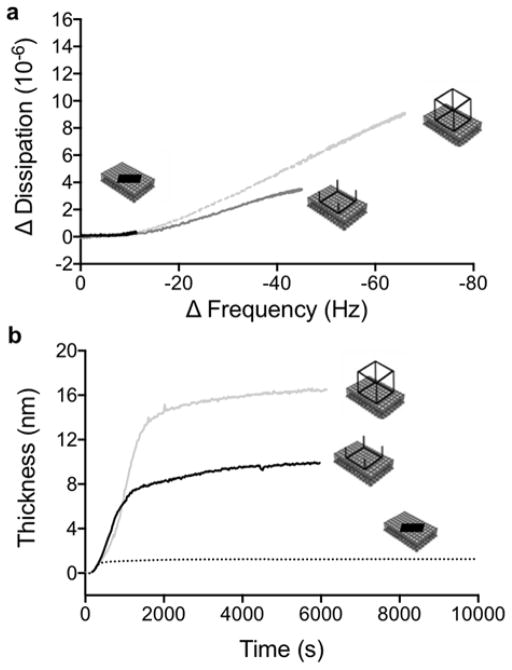
Figure 3.
(a) A correlation plot of ΔD as a function of ΔF for RNA9-10 (black curve), RNA TS3 square (dark grey curve) and RNA polyhedron (light grey curve). (b) The change in thickness of the adsorbed layer after adsorption of RNA polyhedrons (light grey curve), tectosquares (dark grey curve) and RNA9-10 (dotted black curve) to a deposited DOTAP bilayer, as calculated from the fitted QCM data. (Overtone 7)

