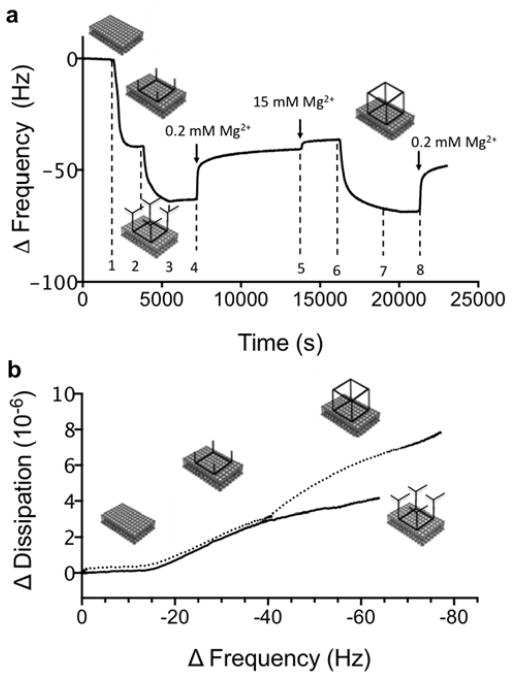
Figure 5.
a) QCM frequency data (overtone 7) for a sequential experiment. (step 1) TS3 is first adsorbed on a DOTAP bilayer. After rinsing in buffer (15 mM Mg2+); (step 2) the At1′ tRNA unit is added, leading to a decrease in ΔF, i.e. increase in mass; (step 3) Rinsing in buffer with 15 mM Mg2+ does not affect the adsorption, while (step 4) rinsing in buffer with 0.2 mM Mg2+ lead to an increase in ΔF, indicating desorption. Quantitative comparisons can only be done between situations where the buffer is the same, i.e., after the (step 5) subsequent change to the buffer with 15 mM Mg2+. The magnitude of the overall increase in ΔF after the rinsing steps (steps 3–5) is almost equal to the increase in ΔF upon At1′ adsorption (step 2); (step 6) The full TS4 RNA square is then added. This leads to significant decrease in ΔF, which implies that the tail regions of the pre-adsorbed TS3 tectosquare are again available for base pairings with those from TS4. Finally, (step 7) rinsing in buffer with 15 mM Mg2+ does not lead to desorption, while (step 8) rinsing in buffer with 0.2 mM Mg2+ leads partial desorption of TS3. (b) A correlation plot of ΔD as a function of ΔF (on=7) for the surface assembly of At1′ tRNA units to the pre-adsorbed TS3 (solid line) and for the addition of TS4 to pre-adsorbed TS3 (dotted line).

