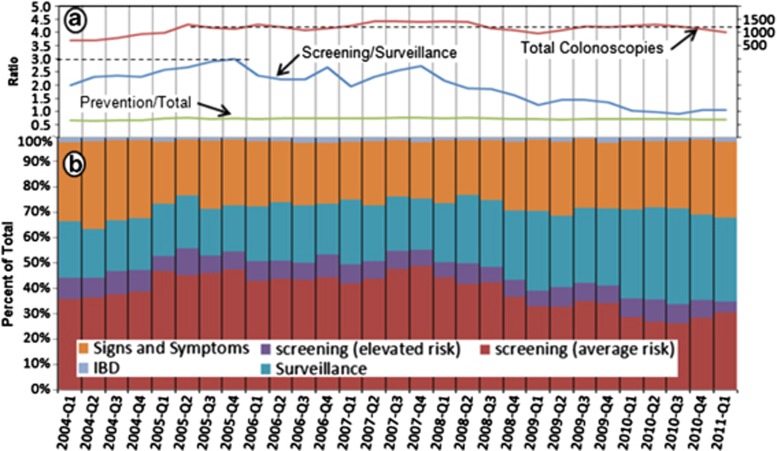
Figure 2.
Trends over time in colonoscopy utilization. (a) Key metrics for monitoring colonoscopy utilization by fiscal year quarter. Total colonoscopies represents the number of procedures performed per quarter for all indications and denoted by the red line (number of exams is on the right axis of the graph). The ratio of screening/surveillance examinations performed by quarter is noted by the blue line. The ratio of screening and surveillance colonoscopies performed to the total colonoscopies performed (including for symptoms) is noted by the green line. (b) Percentage of total colonoscopies per fiscal year quarter for indications as noted in the key (signs and symptoms, average risk screening, elevated risk screening, inflammatory bowel disease, and surveillance). Average risk screening was defined as a person who did not have symptoms, or had a family history of colorectal cancer in only 1 first-degree relative older than 60 years of age. Elevated risk screening was defined as an asymptomatic person who had a family history of 1 first-degree relative diagnosed with colorectal cancer at age 60 years or younger or who had 2 first-degree relatives diagnosed with colorectal cancer at any age. Screening examination was defined as a person who had a baseline colonoscopy with pathology dictating a recall colonoscopy.

