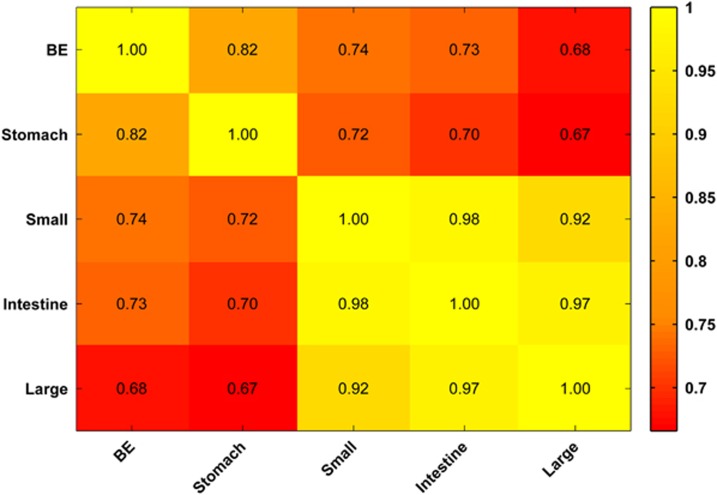
Figure 3.
Heatmap displays the correlation coefficients of global miRNA sequencing profiles of BE epithelia compared with those of normal gastric, small intestinal and large intestinal epithelia. Under 'intestine', the miRNA profiles of the small and the large intestine were combined for analysis. Although there is a gradient in correlation as a function of the proximity of the organs, global miRNA profiles of various columnar epithelia are quite similar.

