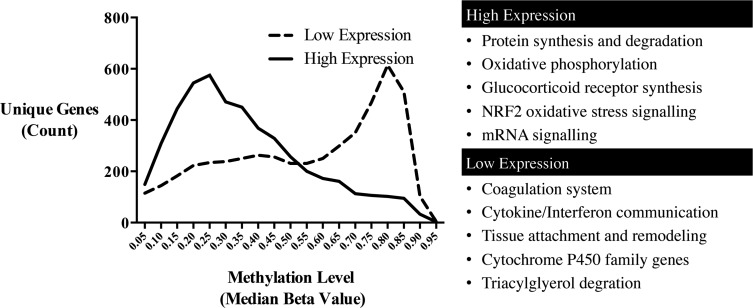
FIG. 3.
Histogram of gene methylation levels (median) according to expression levels. The distribution of DNA methylation levels for the genes with highest mRNA/gene expression (n = 5000) was compared with the genes with lowest mRNA/gene expression (n = 5000). Cellular functions identified as enriched through pathway analysis are listed for high and low expression level groups.

