FIG. 1.
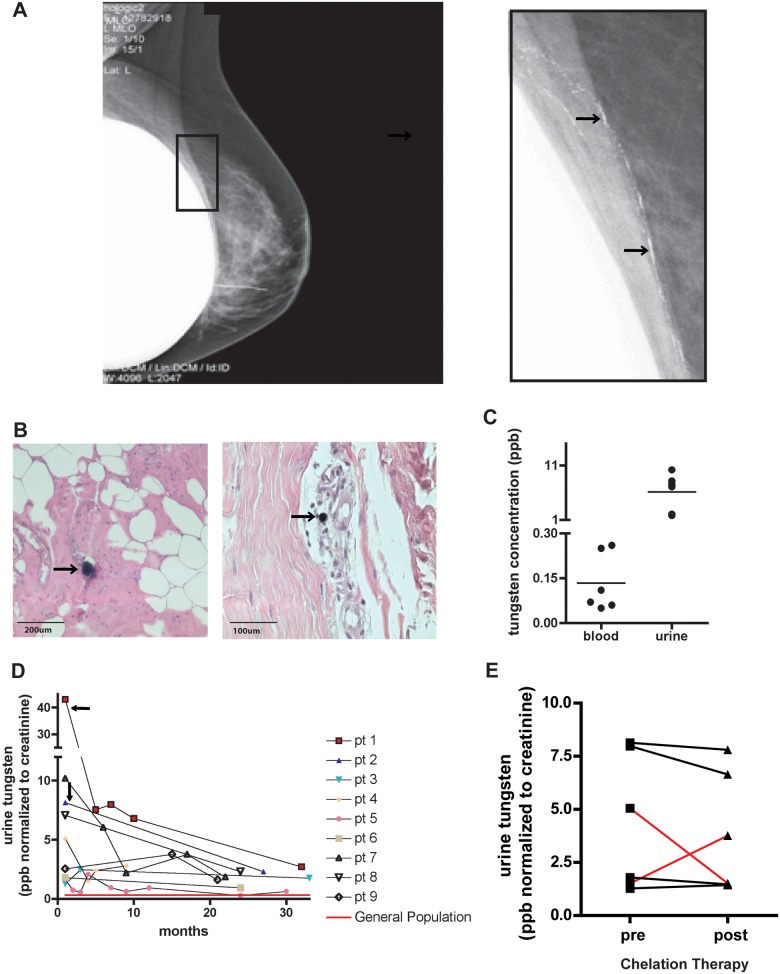
Breast cancer patients were exposed to tungsten during a recent clinical trial. A, Digital mammography image of a patient’s breast post-surgery. Enlarged image shows white deposits (black arrows) that were biopsy-confirmed to be tungsten particles. B, Representative images of H&E-stained breast tissue from a patient who opted for a mastectomy (Left, 10×, Right, 20×). Black arrows indicate tungsten particles surrounded by inflammatory cells (purple cellular staining). C, Matched patient blood and urine tungsten concentrations (ppb). Graph shows samples where blood and urine samples were taken within a close timeframe and were collected between 0 and 5 months post-surgery. Graph represents the mean concentrations (horizontal line) among individual data points. D, Longitudinal monitoring of patient’s urinary tungsten concentrations starting as soon as possible after point of exposure. In patients 1 and 2, black arrows indicate point of mastectomy to remove residual tungsten in the breast. Red line indicates average urinary tungsten levels for the general population in United States and Canada. E, Urinary tungsten concentrations pre- and post-chelation treatment. Lines indicate pre- and post-measurements for the same patient. Red lines indicate 1 patient that responded after first treatment (concentration increased), but then did not respond after second treatment (concentration decreased).

