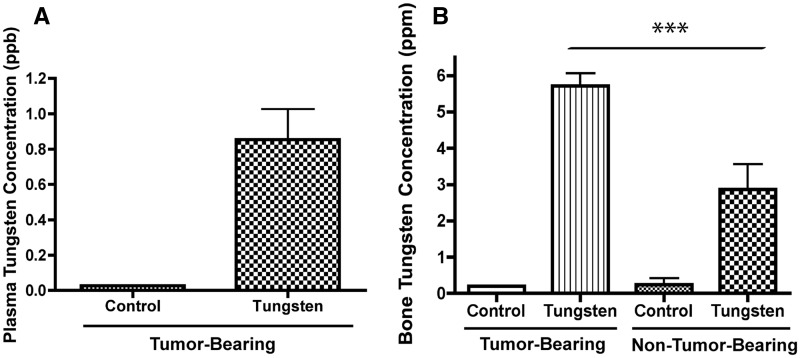
FIG. 2.
Tungsten concentrations in the plasma and bone in the 66Cl4 orthotopic model. A, Plasma tungsten concentrations in control and tungsten-exposed, tumor-bearing mice. Graph shows mean ±SE (n = 3). B, Bone tungsten concentrations in control and tungsten-exposed, tumor-bearing and non-tumor-bearing mice. Graph shows mean ± SE (n = 6). ***P < 0.001, 1-way ANOVA.

