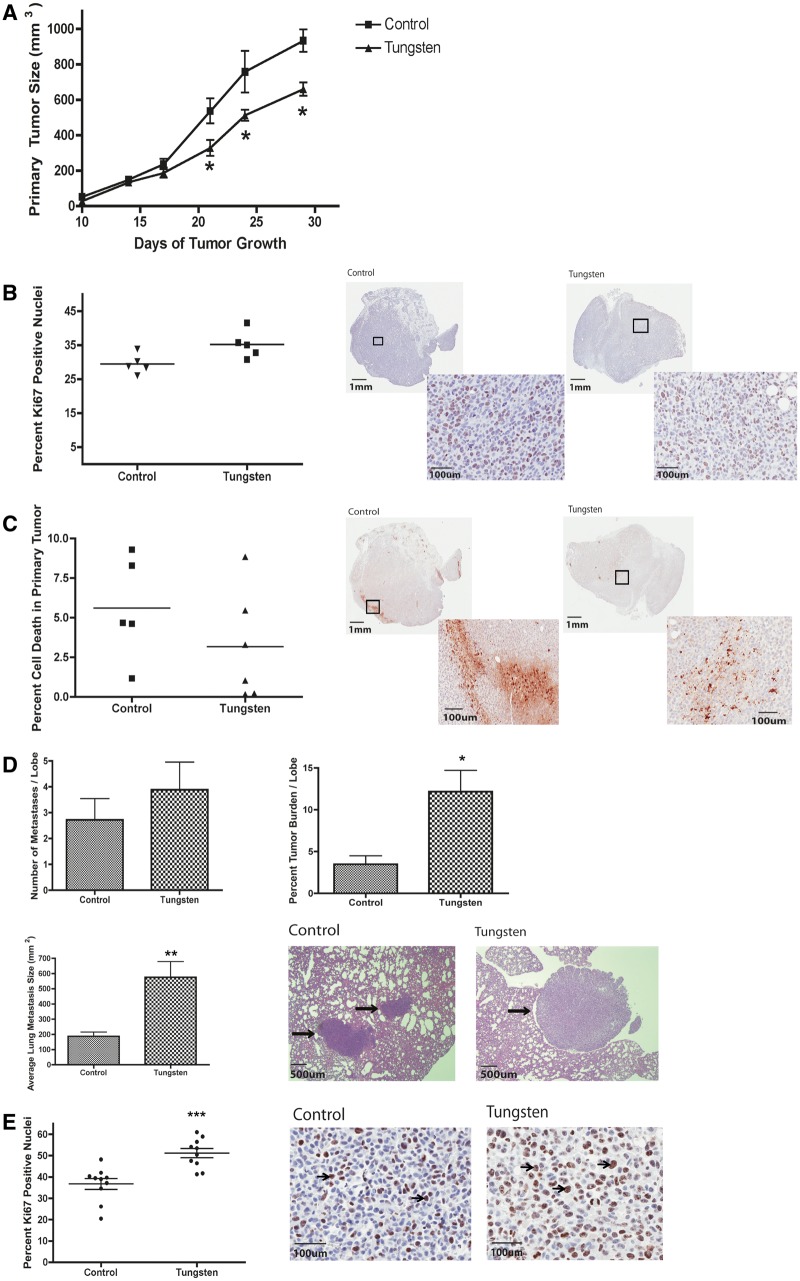
FIG. 3.
Tungsten slightly delays primary mammary tumor growth, but significantly increases lung metastases. A, Primary tumor size was monitored throughout tumor progression. Graph represents the mean ± SE for control and tungsten-exposed mice (control n = 6, tungsten n = 7). *P < 0.05, 2-way ANOVA. B, Percent Ki67-positive nuclei in primary tumor sections. Graph shows the mean (horizontal line) percent Ki67-positive nuclei per section for each group. Representative images of Ki67 stained tumor sections (0.7 × and 20 × ). C, Percent cleaved caspase-3 in primary tumor sections. Graph shows the mean (horizontal line) percent area positive for cleaved caspase-3 per section per group. Representative images of cleaved caspase-3 stained tumor sections (0.7 × and 20×). D, Lung metastasis analysis in tumor-bearing mice. Graphs shows the mean ± SE for the number of metastasis per lobe, the average size of metastasis per animal, and the percent tumor burden per lobe for each group (control: n = 5, tungsten: n = 6). *P < 0.05, **P < 0.01 unpaired Student’s t test. Representative images of H&E stained lung sections showing normal and metastatic (black arrows) tissue (5×). E, Percent Ki67-positive nuclei in metastatic lesions. Graph represents the mean (horizontal line) ± SE percent Ki67-positive nuclei per metastatic region for each group. ***P < 0.001 unpaired Student’s t test. Representative images of Ki67 stained metastatic lesions (20×). Arrows indicate Ki67-postive cells.

