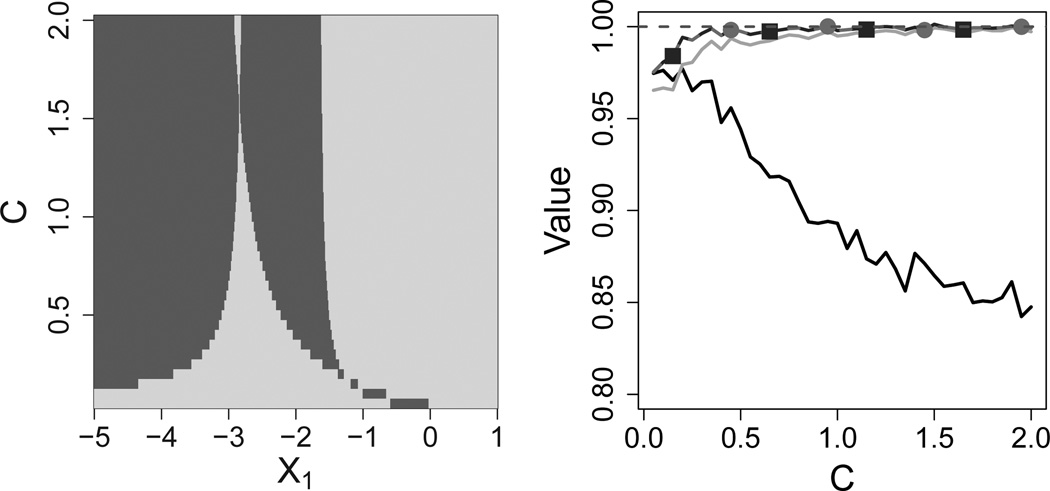
Fig. 3.
A scenario where IQ-learning achieves a large gain in value over Q-learning. The constant C determines the second-stage treatment effect size, from no treatment effects (C = 0) to large effects (C = 2). In the left panel, (X1, C) pairs where linear Q-learning agrees and disagrees with the true first-stage rule are shown in dark and light gray, respectively, where X1 is a normally distributed first-stage covariate. On the right, average proportion of optimal value attained by the normal IQ-learning estimator, nonparametric IQ-learning estimator, support vector regression Q-learning, and linear Q-learning regimes shown by gray lines with squares, gray lines with circles, light gray lines, and black lines, respectively.

