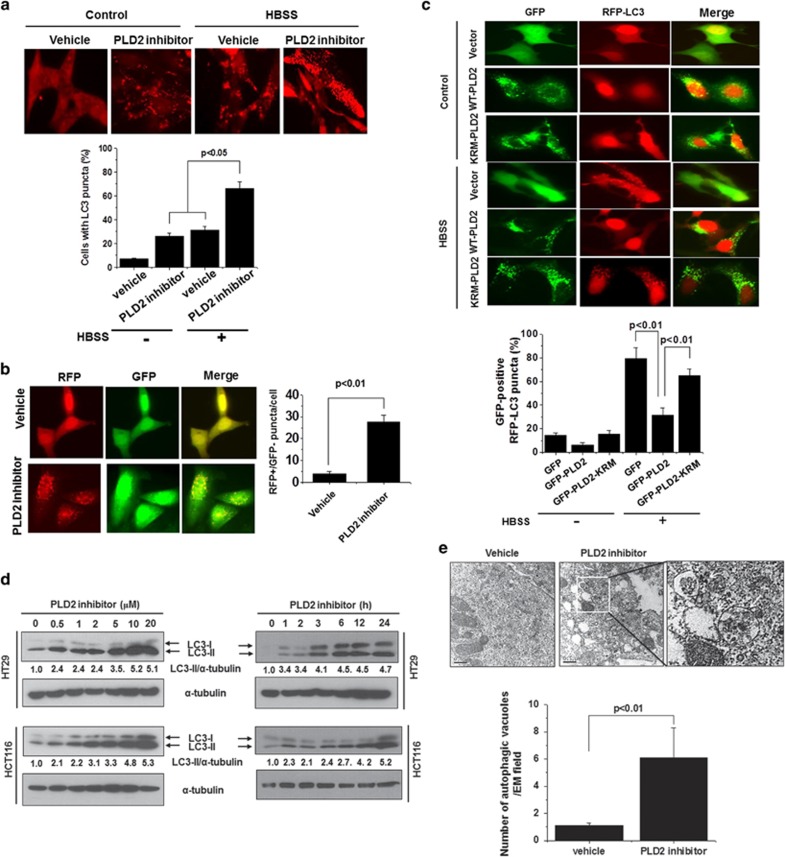
Figure 2.
Inhibition of PLD2 activity induces autophagy. (a) HT29 cells were pre-treated with or without PLD2 inhibitor (10 μM) for 1 h and then cultured in normal or HBSS medium for 6 h. The cells were then fixed, permeabilized and stained with a Texas Red-conjugated antibody specific for endogenous LC3, and the number of LC3 puncta per cell was counted (7–10 cells were assessed). The data are representative of three independent experiments. (b) HT29 cells were transfected with mRFP-GFP-LC3 and then pre-treated with or without PLD2 inhibitor (10 μM) for 1 h, after which the cells were cultured in normal or HBSS medium for 6 h. Autolysosomes were quantified by counting the RFP-positive/GFP-negative puncta per cell (7–10 cells were counted). (c) HT29 cells were co-transfected with GFP vector, GFP-WT-PLD2 or GFP-KRM-PLD2 and RFP-LC3 and then cultured in HBSS or normal medium for 6 h, after which the percentage of RFP punctate cells relative to the percentage of GFP-expressing cells was determined. The data are representative of three independent experiments. (d) HT29 and HCT116 cells were treated with the indicated concentrations of PLD2 inhibitor for 12 h or with 10 μM of PLD2 inhibitor for the indicated time, and the lysates were immunoblotted with the indicated antibody. The level of LC3-II compared with that of α-tubulin was quantified using densitometer analysis. The data are representative of three independent experiments. (e) HT29 cells were treated with PLD2 inhibitor (10 μM) for 12 h and then fixed and examined by transmission electron microscopy to visualize autophagic vacuoles. The quantification was based on counting the autophagic vacuoles in the field of view. Arrows indicate autophagic vacuoles. The values are the means±s.d. of three independent experiments.

