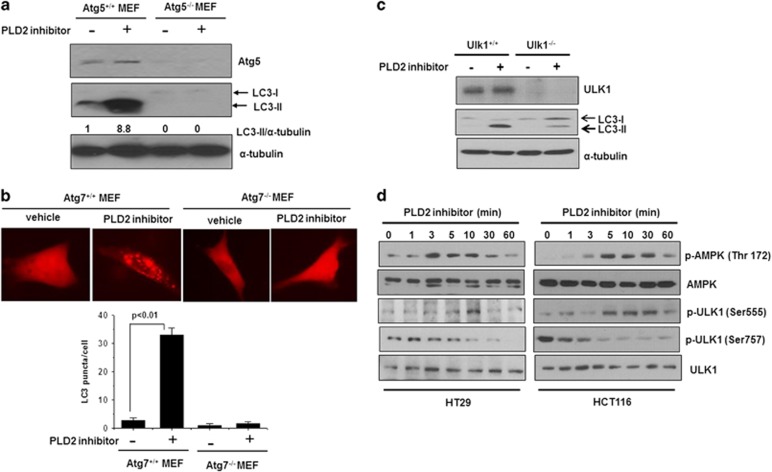
Figure 3.
PLD2 inhibition induces autophagy via Atg5-, Atg7- and Ulk1-mediated pathways. (a) Atg5 MEFs were treated with or without PLD2 inhibitor (10 μM) for 6 h, and the lysates were immunoblotted with the indicated antibodies. The level of LC3-II compared with that of α-tubulin was quantified by densitometer analysis. The data are representative of three independent experiments. (b) Atg7+/+ and Atg7−/− MEFs were transfected with RFP-LC3 for 24 h and then treated with PLD2 inhibitor (10 μM) for 6 h. RFP-LC3 punctate dot cells were observed by fluorescence microscopy, and the number of RFP punctate cells was quantified. The values are the means±s.d. of three independent experiments. (c) Two isogenic MEF cell lines (Ulk1+/+ and Ulk1-null) were treated with PLD2 inhibitor (10 μM) for 6 h, and the lysates were immunoblotted with the indicated antibodies. The data are representative of three independent experiments. (d) HT29 and HCT116 cells were treated with PLD2 inhibitor (10 μM) for the indicated time, and the lysates were immunoblotted with the indicated antibodies. The data are representative of three independent experiments.

