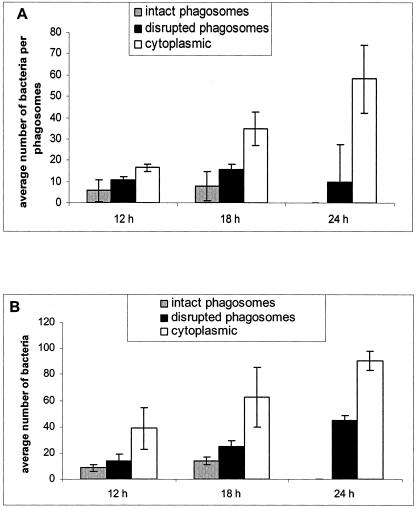
FIG. 9.
Numbers of bacteria per phagosome (or per cell when cytoplasmic) within macrophages (A) and A. polyphaga (B) at 12, 18, and 24 h postinfection. The minimum average number of bacteria per phagosome was obtained by single-cell analysis by electron microscopy. Averages of 60, 50, and 10 to 30 LCPs were analyzed for both macrophages and A. polyphaga at 12, 18, and 24 h, respectively. At 24 h, the number of LCPs analyzed was low because most of the cells had been lysed. Error bars represent standard deviations.

