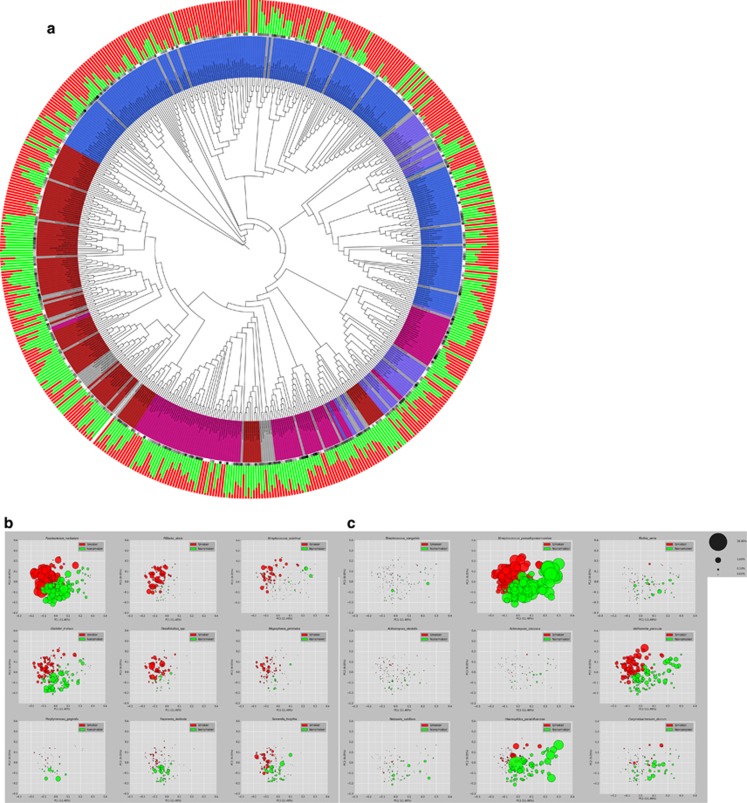
Figure 2.
(a) Phylogenetic tree of the 572 s-OTUs. It was generated using the interactive tree of life web application (http://itol.embl.de/). The outermost circle indicates the normalized mean relative abundances of the s-OTUs in nonsmokers (green) and smokers (red). Overall abundances for each OTU are indicated by the black-to-gray circular gradient (middle circle). The Gram staining and oxygen requirement characteristics are represented by the innermost circle with Gram-negative aerobes (red), Gram-negative anaerobes (magenta), Gram-positive aerobes (blue), Gram-positive anaerobes (purple) and unknown characteristics (gray). (b, c) The relative abundance of selected species in current smokers and nonsmokers. PCoA plots of the UniFrac distances are shown, with the size of each bubble representing the abundance of the species in that sample.

