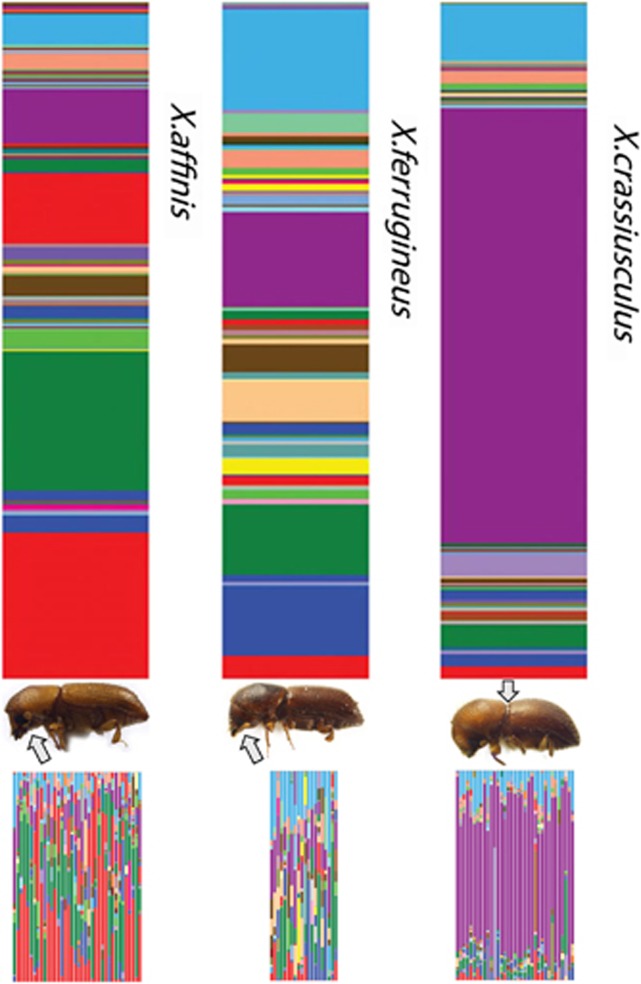
Figure 2.
Stack plot showing species richness and evenness of mycangial fungal communities of the three beetle species. Upper stacks report averages within each species, lower stacks report communities in each individual. Each color band represents different fungal OTU; the band width corresponds to the relative abundance of reads of the OTU in the data set. Arrows point out the two different types of mycangia.

