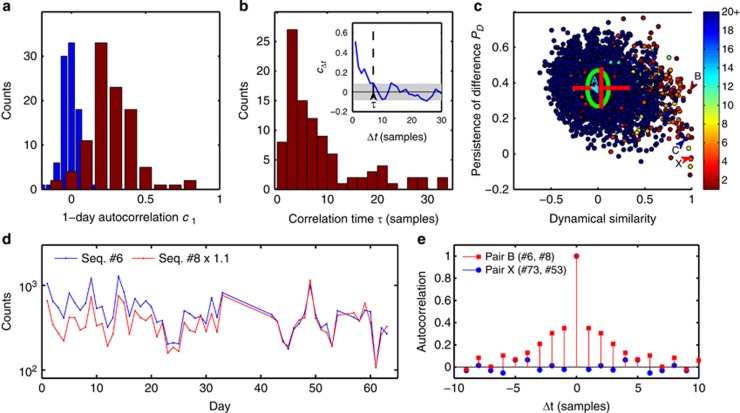
Figure 3.
Dynamical similarity versus 16S similarity. (a) 100 most abundant sequences of the population exhibit significant autocorrelation. Histogram of autocorrelation coefficients of sequence abundance for consecutive samples (red), and after randomly permuting sample labels (blue). (b) Histogram of autocorrelation times of 100 most abundant sequences. We define the autocorrelation time τ as the time shift Δt at which the autocorrelation function cΔt falls below the threshold of statistical significance as illustrated in the inset (see Supplementary Information). For 19 sequences the autocorrelation time exceeds 35 days (not shown). (c) Persistence of difference PD for all pairs of sequences from the top 100, plotted against the correlation of their abundances (normalized by maximum expected correlation cmax). Green ellipse indicates mean and standard deviation for the null model obtained by reversing in all pairs the time order for one of the sequences. Most pairs are consistent with the null model, except for a broadening of the correlation coefficient distribution (mean and standard deviations indicated by the red cross). Pairs to the right of the plot are dynamically similar (strong abundance correlation), often accompanied by high sequence similarity (color code indicates Hamming distance between aligned sequences in the pair; see Supplementary Information). Of these, a subset (bottom right) also exhibit weak or negligible persistence of difference. These pairs, such as pair ‘X', most likely correspond to genomic 16S variants found within a single bacterium. Letters A–C identify pairs shown in Figures 2a–c. The large persistence of difference identifies pair B as coming from distinct bacterial cells. (d) Sequence counts versus observation day for early samples of Seq. #6 and #8 (99.2% similarity), normalized as in Figure 2b but excluded there due to relatively poor sequencing depth. The clear separation observed prior to day 40 confirms that these two sequences are contributed at least in part by distinct bacterial subpopulations. (e) Autocorrelation functions of the relative difference Δ(t) for two pairs identified in c: pair ‘B' (red squares; high PD indicative of distinct bacterial cells) and pair ‘X' (blue circles; low PD indicative of 16S variants found within a single bacterium).

