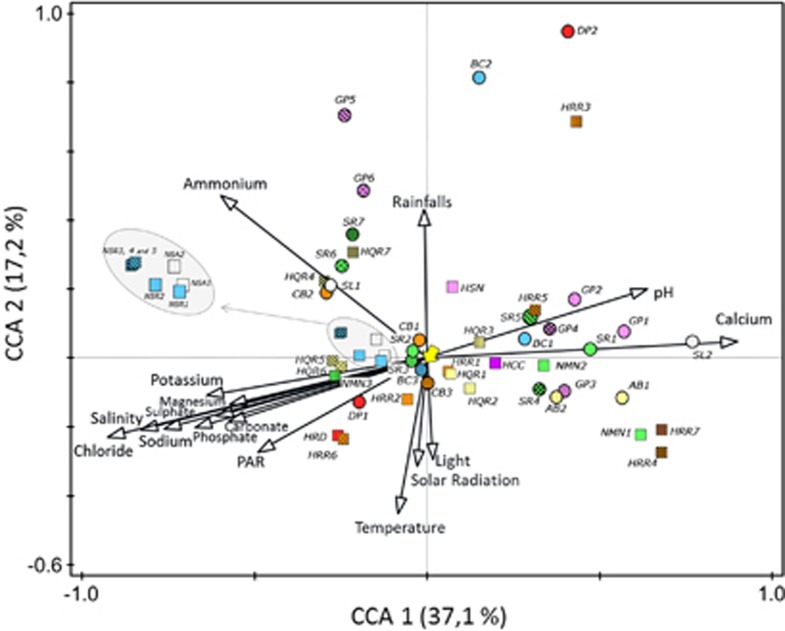
Figure 5.
Canonical correspondence analysis (CCA) ordination biplot of phylotypes (symbols) and environmental parameters (arrows). Zone A (right) is defined by low salinity, high calcium concentration and high pH values; zone B (center) represents medium values (and non-determining environmental factor) and zone C (left) high salinity, low calcium concentration, and low pH. Archaeal (squares) and bacterial (circles) phylotypes are named as in Tables 1 and 2. Symbol colors are as in Figure 2. The yellow arrow points to BC3 phylotypes, which were further analyzed by SGC. Nanosalina (white) and Nanosalinarum phylotypes (blue squares) are enclosed within a grey line.

