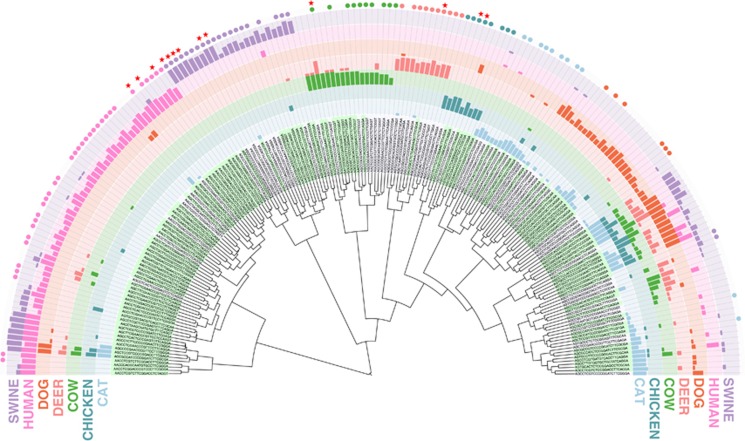
Figure 5.
Dendrogram of Blautia oligotypes and their host occurrence patterns. Bars show the proportion of animal or human samples in which the given oligotype is present. Circles indicate host-associated oligotypes. Host-specific oligotypes are denoted with stars. Background colors for oligotypes alternate between green and gray, where green indicates that a perfect hit with 100% coverage is found for a given oligotype in NCBI's non redundant database.

