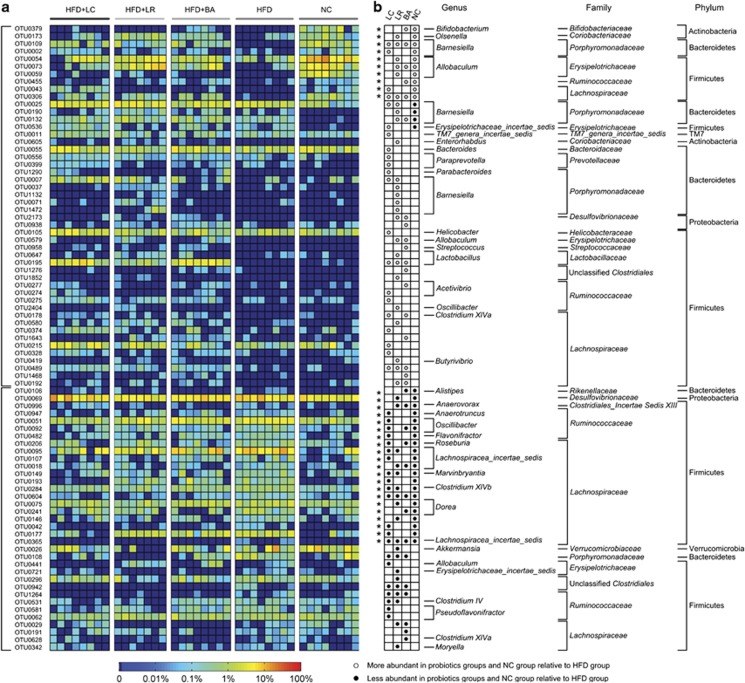
Figure 4.
Eighty-three OTUs that were changed in abundance by probiotics according to redundancy analysis (RDA). (a) Heatmap of the abundance of 83 OTUs. Rows correspond to 48 OTUs enriched and 35 OTUs reduced. (b) The changing direction of the 83 OTUs by probiotics according to RDA. Circles and dots indicate the abundance of OTUs that were more and less abundant, respectively, in probiotics groups and NC group relative to HFD group. The taxonomy of the OTUs (genus, family and phylum) is depicted on the right. Asterisk (*) represents the OTU whose abundance was changed by HFD and then the change was reversed by probiotics.

