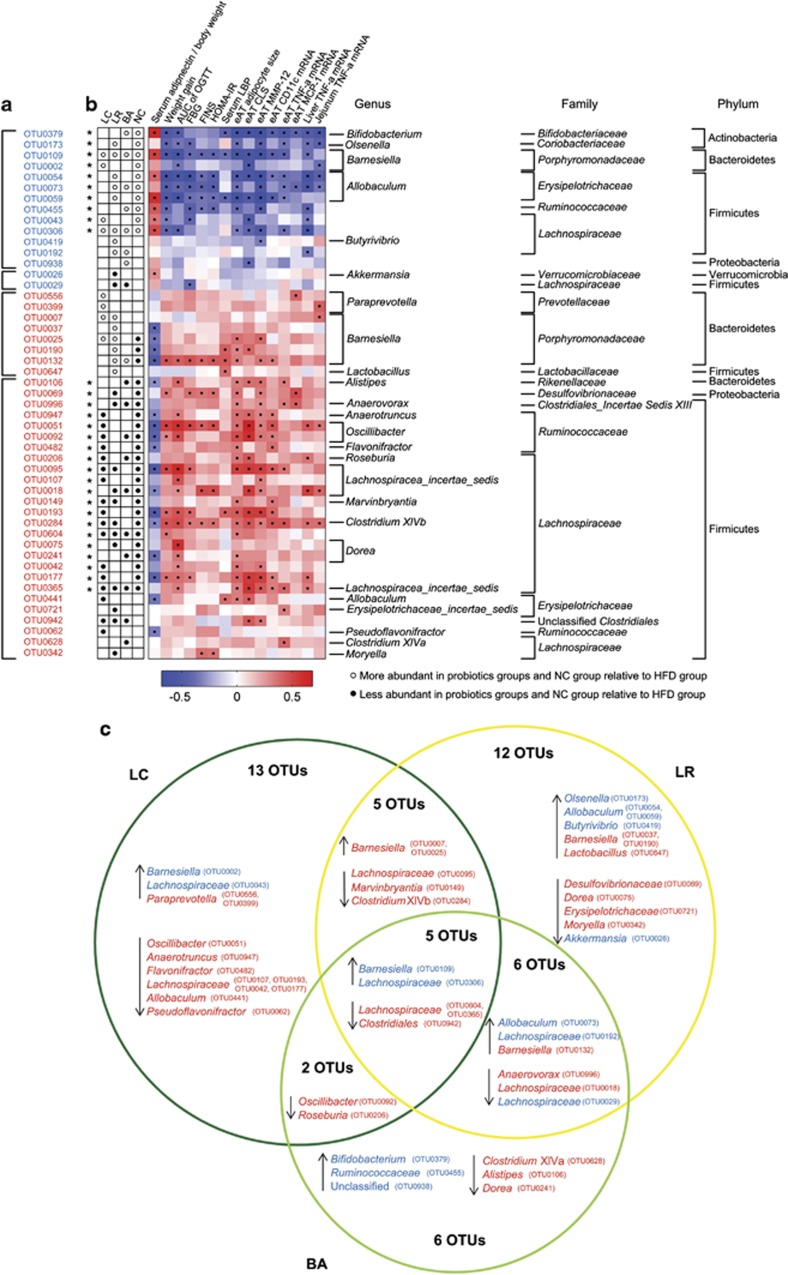
Figure 5.
Forty-nine probiotic-altered OTUs that were significantly correlated with host MS parameters. (a) The changing direction of the 49 OTUs. Circles and dots indicate the OTUs that were more and less abundant, respectively, in the probiotics groups and NC group relative to the HFD group. Asterisk (*) represents OTU whose abundance was changed by HFD and then the change was reversed by probiotics. (b) The correlation between 49 OTUs and host MS parameters. Rows correspond to OTUs with the IDs shown on the left, and columns correspond to MS parameters related to obesity, glucose–insulin homeostasis and inflammation. Colors red and blue denote positive and negative association, respectively. The intensity of the colors represents the degree of association between the OTU abundances and host parameters as assessed by the Spearman's correlations. The black dots in the blue/red cells indicate that the associations were significant (false discovery rate<0.25). The taxonomy of the OTUs is shown on the right. (c) Venn diagrams of 49 OTUs. The OTUs' taxonomy is listed, and blue and red mean that the OTU was negatively and positively, respectively, correlated with MS parameters. ↑ means increased by probiotics, and ↓ represents decreased by probiotics.

