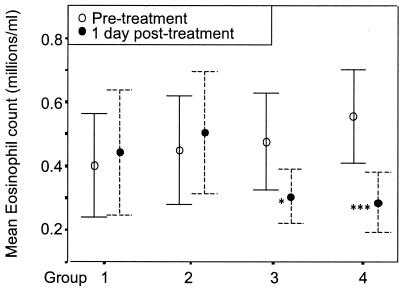
FIG. 4.
Increase in plasma IL-5 level and the accompanying decrease in eosinophil counts. Subjects were divided into four equal groups (n = 16 per group) based on the increase in their plasma IL-5 levels between pretreatment and 1 day posttreatment. Group 1 increase, 0 pg/ml; group 2, 2.5 to 24 pg/ml; group 3, 25 to 100 pg/ml; group 4, >100 pg/ml. The mean eosinophil counts ± 95% confidence limits at pretreatment and 1 day posttreatment are shown for the four groups. Groups where there was a significant difference (paired t test) between pretreatment and 1 day posttreatment are indicated by *** (P = 0.001 to 0.01) and * (P = 0.01 to 0.05).

