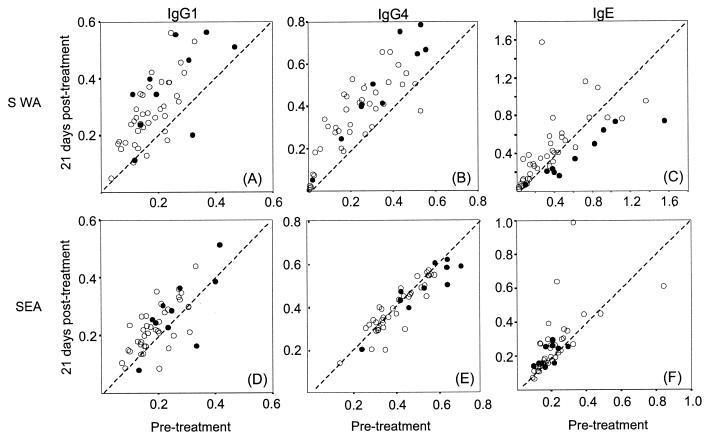
FIG. 5.
Antibody responses before and after treatment and the influence of the peak in plasma IL-5 level. Shown are scatter graphs of the pretreatment versus 21-day-posttreatment levels of IgG1, IgG4, and IgE directed against SWA and SEA. Each circle represents an individual volunteer (n = 51), and those in group 4 (first day posttreatment increase in plasma IL-5, >100 pg/ml) are indicated as filled circles. Levels were determined by isotype-specific ELISA, and the values represent means of triplicate optical density measurements.

