. 2014 Sep 11;7(1):60–68. doi: 10.4168/aair.2015.7.1.60

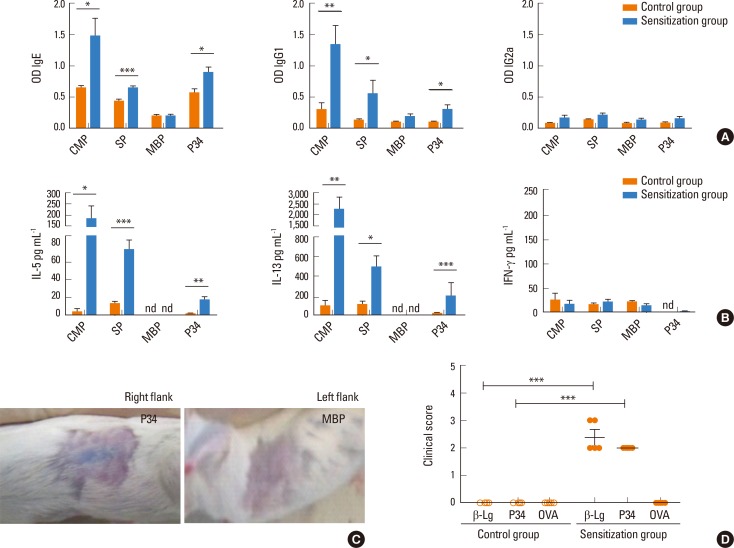
Fig. 4. Immune responses to milk and soy proteins. (A) Specific IgE (by EAST), IgG1 and IgG2a (by ELISA) in serum of milk-sensitized mice (mean values±SEM). (B) Levels of IL-5, IL-13 and IFN-γ (by ELISA) in supernatants of stimulated spleen cells (mean values±SEM). Results correspond to a single experiment with at least three mice per condition representative of three separate experiments with similar results. (C) Cutaneous test in sensitized mice subcutaneously injected with P34 in the right flank and MBP in the left flank. (D) Clinical scores assigned to symptoms observed within 30 minutes following the sublingual challenge with β-Lg, P34 or OVA. (A) and (B) were analyzed by Student's t-test and (D) with ANOVA test. Statistically significant differences are shown as: *P<0.05, **P<0.01, ***P<0.005, CMP, cow's milk proteins; SP, soy proteins; MBP, maltose-binding protein, β-Lg, beta lactoglobulin; OVA, ovalbumin.

Fig. 4