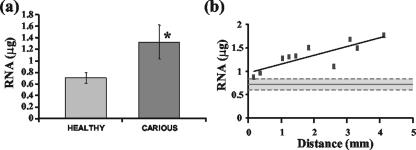
FIG. 1.
(a) Average amount of RNA isolated from 10 diseased and 10 healthy teeth. An asterisk indicates statistically significant difference. Error bars for one standard deviation from the means are shown. (b) Scatter plot displaying the relationship between the amount of RNA isolated and the distance from the microbial front for the 10 carious teeth analyzed (P < 0.003; equation of line was y = 0.1848x + 0.9689; R2 = 0.6896). The solid horizontal line represents the mean total RNA isolated from healthy dental tissue, and dashed lines indicate one standard deviation from the mean.

