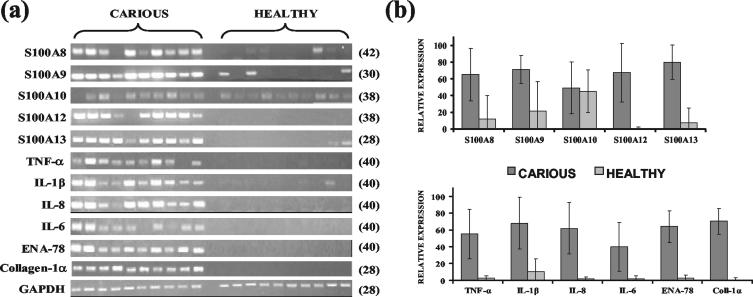
FIG. 2.
(a) Semiquantitative RT-PCR analysis showing differential gene expression analysis in carious and healthy dental tissue samples. The cycle number at which PCRs were analyzed is shown in parenthesis. (b) Densitometric analysis of gel images. Volume densities of amplified products were normalized against GAPDH control values, and average values for each group were calculated and expressed as a percentage of the highest normalized individual volume density obtained. Error bars for one standard deviation from the means are shown. All genes, except S100A10, showed statistically higher expression in carious teeth (P < 0.01).

