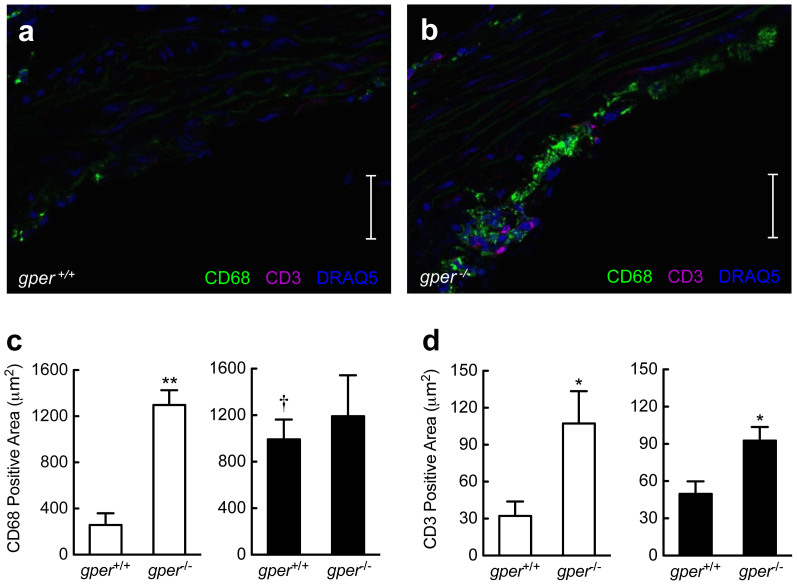
Figure 3. Gper deficiency results in vascular accumulation of inflammatory cells.
Quantification of CD68+ cells (macrophages) and CD3+ cells (T cells) in the aortic root using quantitative immunohistochemistry. Data are shown for ovary intact (open bars) and ovariectomized mice (filled bars) treated with an atherogenic diet. Compared with ovary intact gper+/+ mice (a), (c), deletion of gper yielded a pronounced increase in CD68+ cells (b), (c). Ovariectomy alone also increased staining for CD68+ cells in gper+/+ mice, whereas deletion of gper had no further effect on this increase (c). Compared to either ovary intact or ovariectomized gper+/+ mice (a), (d), respectively, deletion of gper yielded a pronounced increase in CD3+ cells (b), (d). Ovariectomy did not further increase CD3+ staining in either gper+/+ or gper−/− mice (d). *P < 0.05 and **P < 0.01 compared with gper+/+ mice, †P < 0.05 compared to ovary intact genotype-matched mice (ANOVA with Bonferroni post-hoc test). All data (n = 3–6 per group) are mean ± s.e.m. Scale bar, 100 μm.

