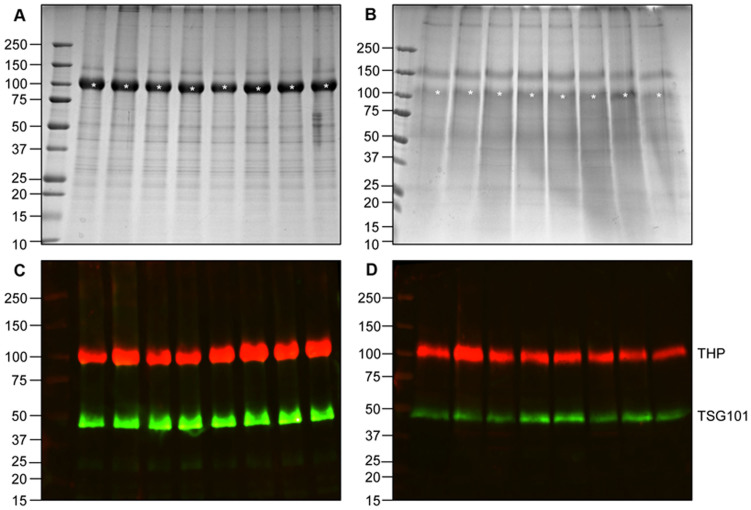
Figure 4. Estimation of vesicle adsorption on the lumen of dialysis membranes.
(A, B) Colloidal Coomassie stained gel of HFDa and SDS elution of protein adsorbed on the surface of the membrane starting from 200 ml of urine, processed in 8 independent devices. Gel loading was based on the BCA assay with 10 µg of protein per lane. C and D, the respective gel as above immunostained for TSG101 and THP. Both membranes run from same experiment and at the same laser intensity set at a value to reach the limit of saturation point of the most abundant band. (TSG101: 153.69 ± 30.97 Kilo Integrated Intensity (KII), limits 190.06–138.14; CV 15.5%; THP 237.60 ± 80.09 KII, limits 332.57–127.28, CV 25.7%) and SDS dialysis membrane fraction (TSG101: 27.93 ± 11.22 KII, limits 46.78–16.05 CV 6.1%; THP 104.15 ± 62.90 KII, limits 267.05–62.56 CV 20.0%). Asterisk at 100 kDa indicates the Tamm-Horsfall Protein. Molecular weights are expressed in kilo Daltons.

