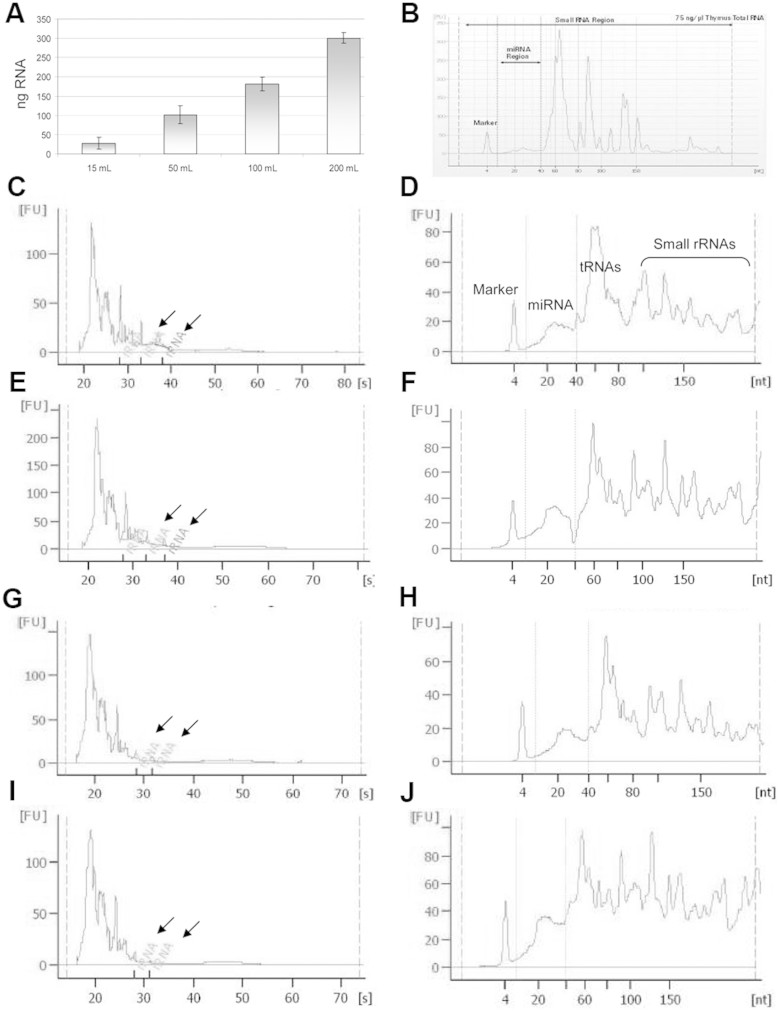
Figure 9. Isolated RNA yield and profile.
(A) Recovered RNA quantity was analyzed using the NanoDrop 1000 spectrophotometer (Thermo Scientific). RNA quality was assessed using the Agilent 2100 Bioanalyzer. (B) Illustrates an example small RNA chip profile (http://www.chem.agilent.com/Library/technicaloverviews/Public/5989-7002EN.pdf). Representative electropherograms of 10 ng of RNA extracted from HFDa obtained from 15, 50,100 and 200 ml of urine respectively were analysed using Pico RNA Chip and show an absence of rRNA peaks (arrows) (C,E,G,I). Electropherograms for small RNA species (D,F,H,J) extracted from HFDa obtained from 15, 50,100 and 200 ml of urine respectively and analysed using the small RNA Chip (Agilent) show the size distribution of small RNAs in interval of 10–150 nucleotides (nt) including microRNA in the size between 10 and 40 nt. The average concentration of the miRNA yield was, as based on the Bioanalyzer results, 4.58 ± 1.33 ng/µl (2.71–7.43 ng/µl, CV = 29%) per 10 ng/µl of total RNA loaded, corresponding to an average of 37.6% of miRNA in respect to small RNA amount.

